
Sentinel-2
The satellites of the Sentinel mission of the European Space Agency (ESA) continuously record the current state of the Earth. The Sentinel fleet consists of several satellites (Figure 1) with different areas of application, such as the monitoring of water bodies, the atmosphere and land cover, but also disaster management. Data from the Sentinel-2 system are particularly suitable for vegetation analyses.
This system consists of two identical optical satellites - Sentinel-2A and Sentinel-2B - making a high temporal resolution of coverage of the Earth's surface possible. The satellites orbit the Earth at an altitude of 786 kilometres and, under cloud-free conditions, allow new images to be taken every five days. Multispectral cameras record the visible light reflected from the Earth's surface as well as the near and shortwave infrared spectrum. The Sentinel-2 images can thus also be used to map changes in land use and forest areas. Freely available pan-European land cover maps (so-called “High Resolution Layers”) are for example derived from the Sentinel data.
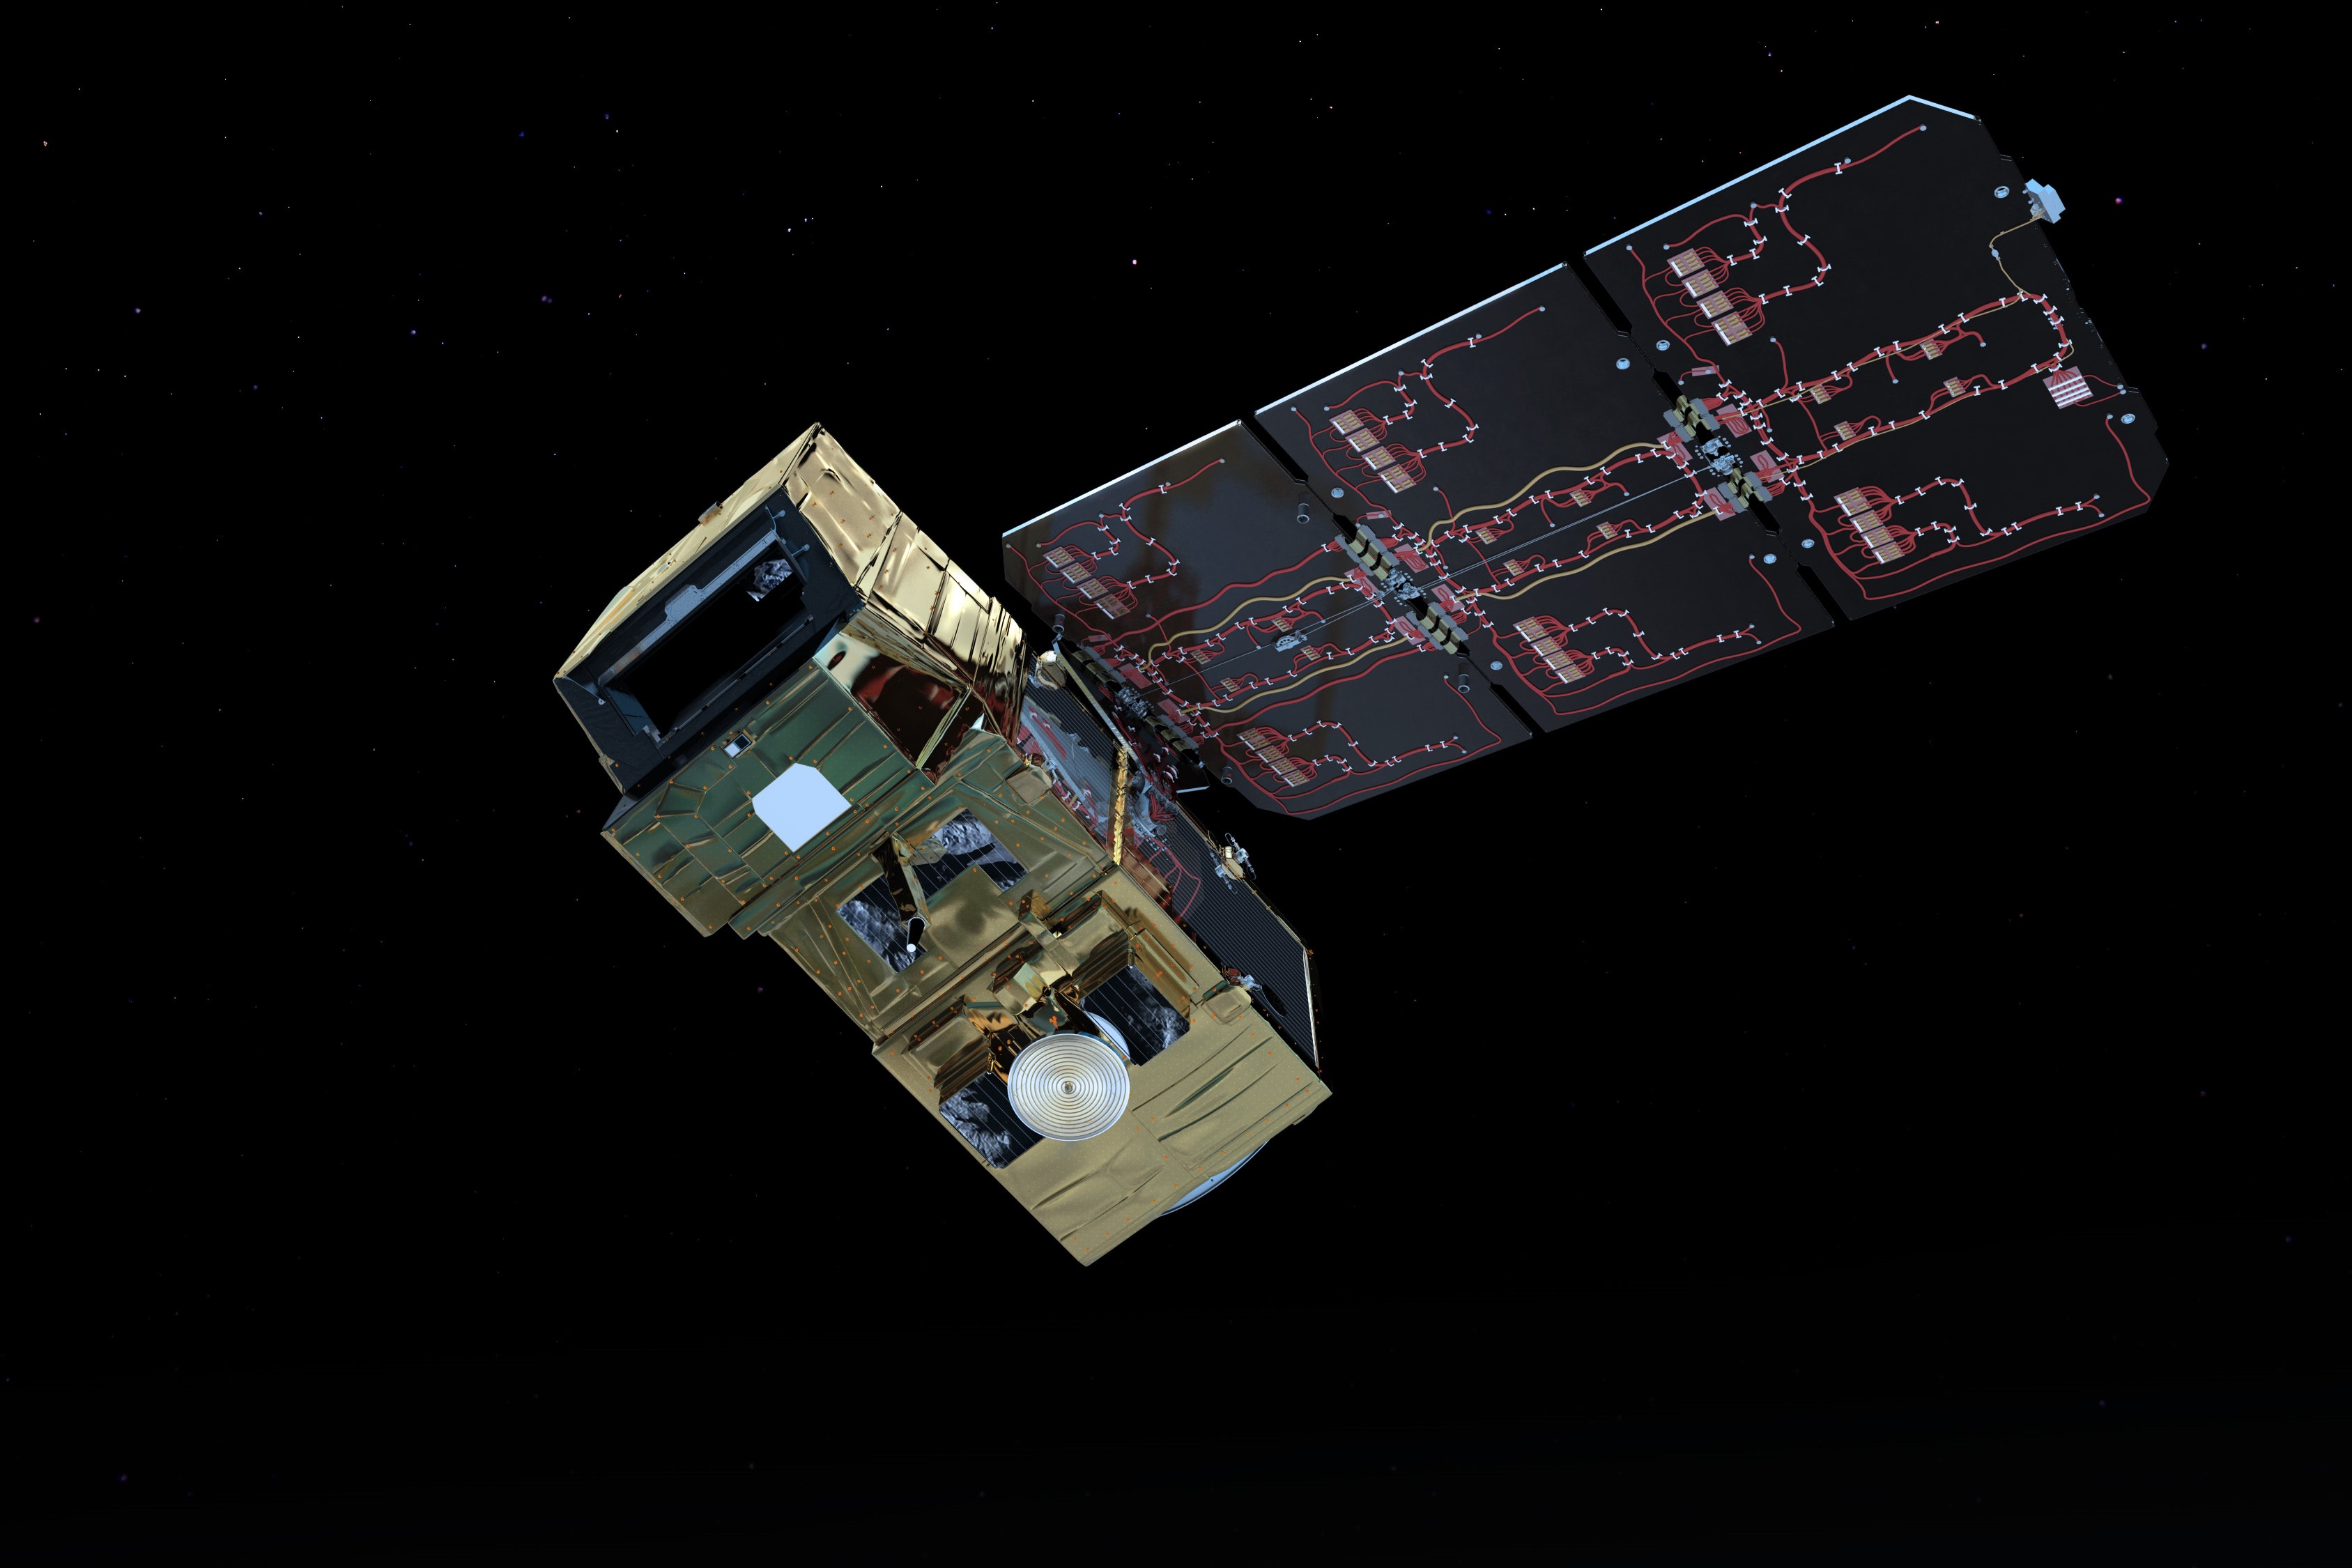
Fig. 1: The Sentinel-2 satellites continuously orbit the Earth. Source: ESA/ATG medialab
Advantages and disadvantages of the Sentinel-2 images
The key advantage of the Sentinel-2 images is that they are available free of charge and cover a very large area thanks to their wide swath width of approximately 290 km. In addition, all Sentinel-2 images are archived by the ESA and past images are thus also available (from July 2015). However, the availability of usable Sentinel-2 scenes is strongly dependent on the weather, as cloud cover in principle prevents the recording of images of the Earth's surface. In a rainy summer, only a few cloud-free scenes can usually be recorded by the satellites. It should also be borne in mind that the Sentinel satellite images “only” have an average spatial resolution of 10 m or 20 m, depending on the spectral range. Analyses at individual tree level are therefore not usually possible with this image data.
Current applications at the LWF
At the LWF, the Sentinel-2 satellite images are used for various analyses and applications, including damage detection, various monitoring programmes and the creation of coniferous and broadleaf forest maps. Some examples of current applications are presented below.
Map showing broadleaf and coniferous forests in Bavaria
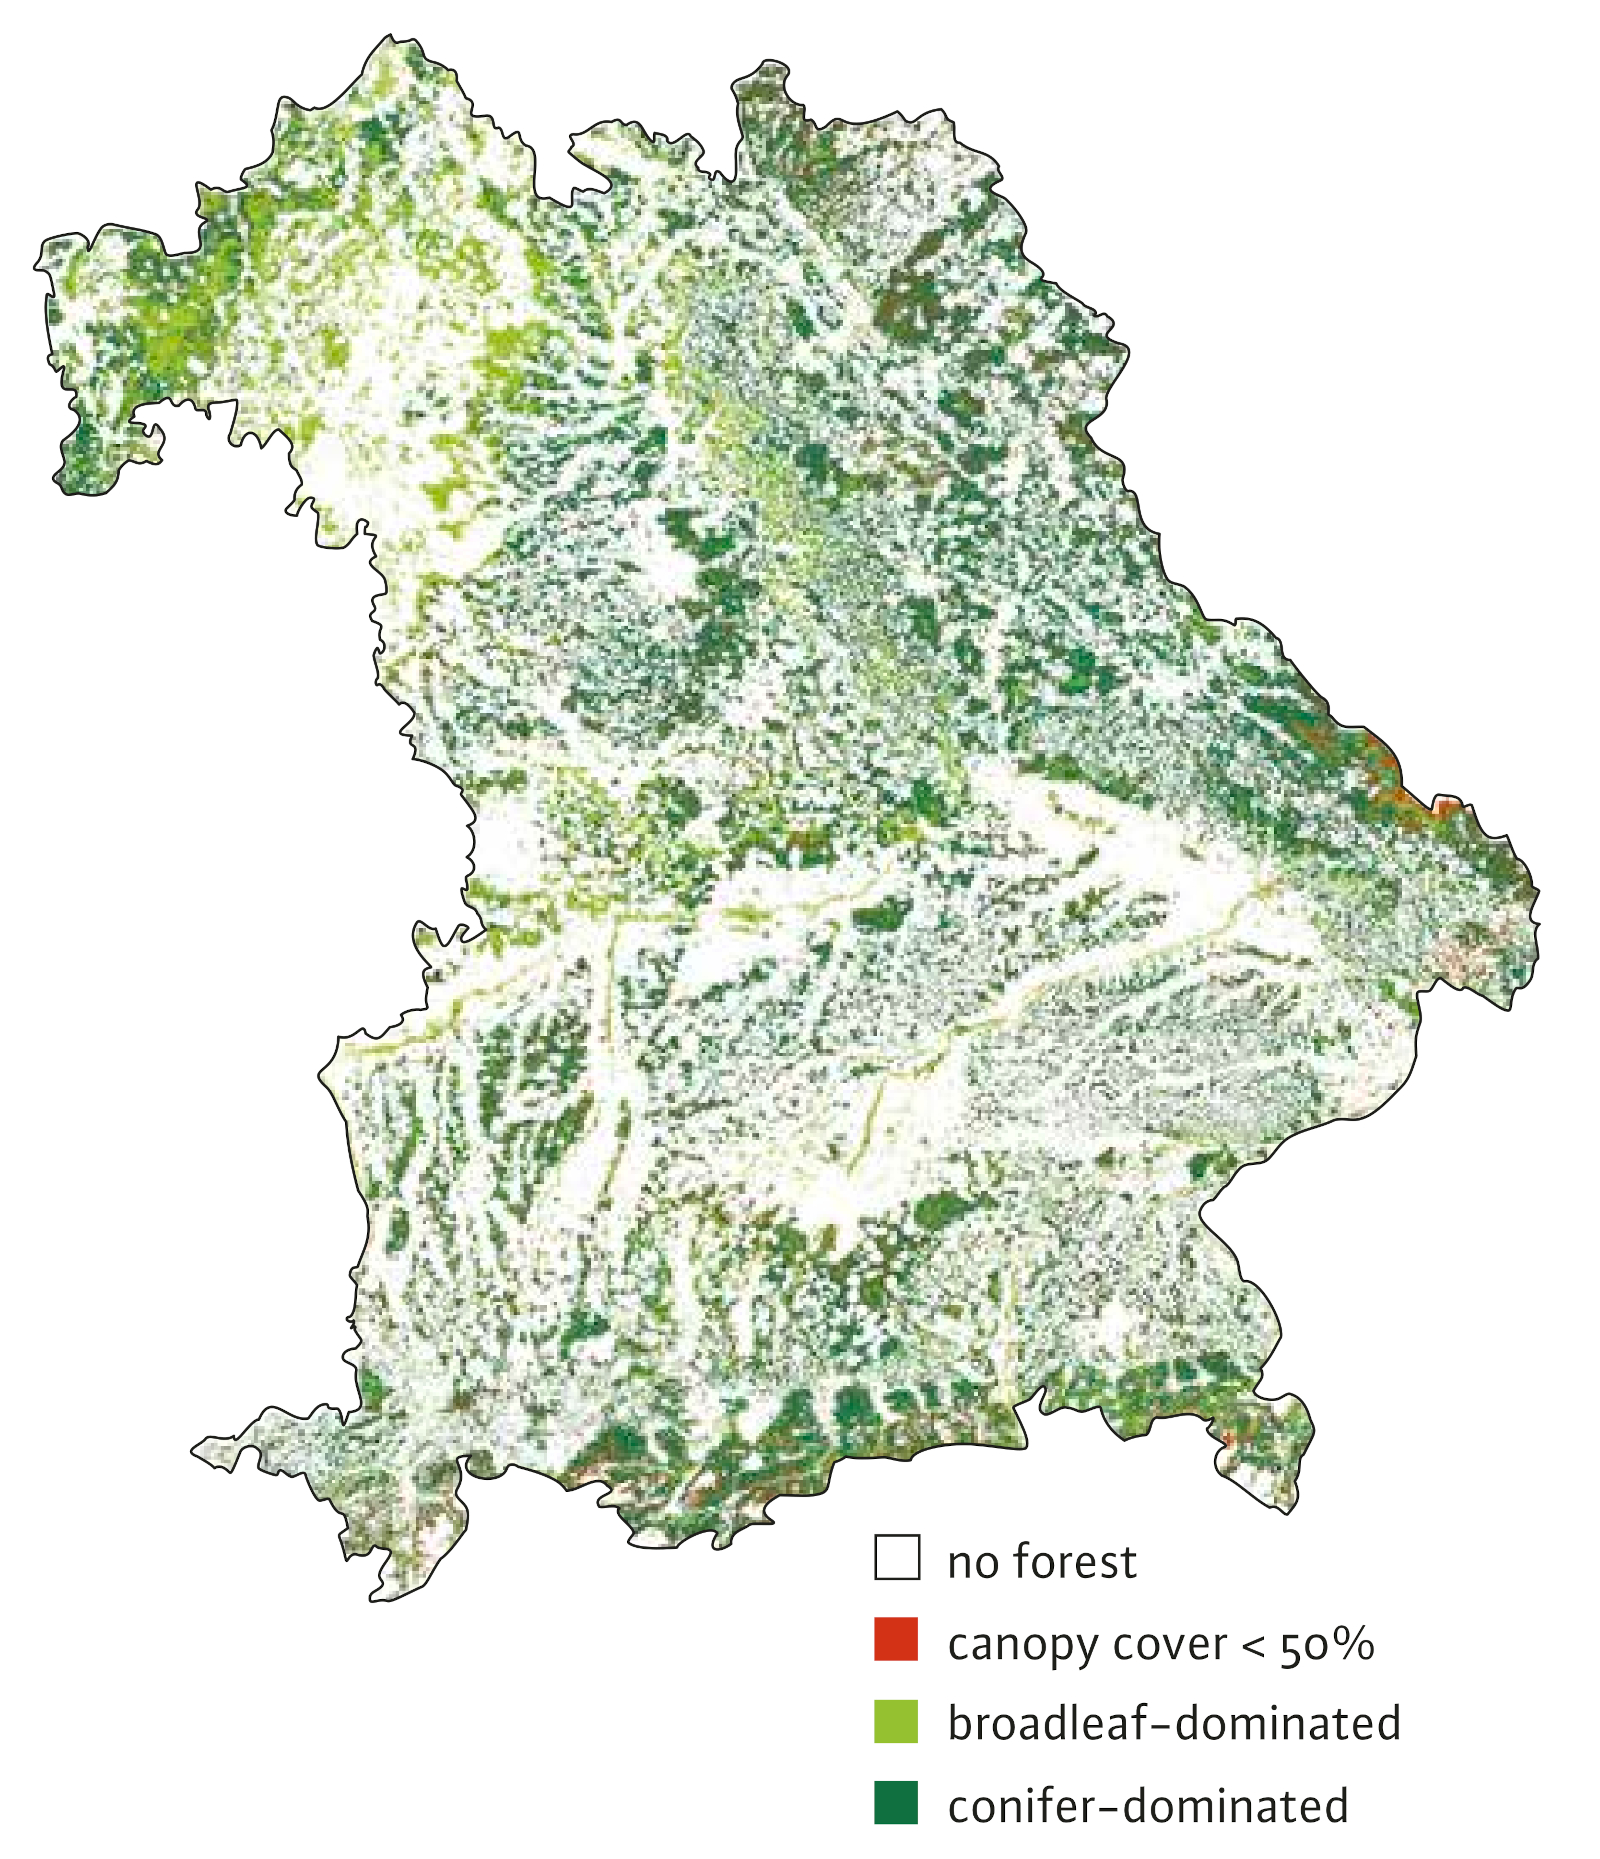
Fig. 2: Map modelled on the basis of Sentinel-2 data and circular sampling plots from the forest inventory in the state forest. Source: Bavarian State Institute of Forestry (LWF)
On the basis of Sentinel-2 image data and circular sampling plots from the forest inventory carried out in the state forest, broadleaf-dominated and coniferous-dominated forest areas were recorded for the whole of Bavaria. The extensive area classification was carried out using the random forest modelling method, which is a frequently used classification technique from the field of machine learning. In this classification, more than 63,000 circular sampling plots of the Bavarian State Forest company were used to develop several regionally adapted models.
In addition, official elevation models of the Bavarian Survey Administration were used in order to identify forest areas with low canopy cover (< 50 %). The end result of the modelling with the classes: a) broadleaf-dominated (i.e. hardwood share > 50 %), b) conifer-dominated (i.e. coniferous share > 50 %) and c) canopy cover < 50 % is shown in Figure 2. The resulting map of broadleaf and conifer-dominated forest (Figure 2) can be used for further analyses of vegetation - to show results separately for broadleaf and coniferous areas, for example.
Damage detection
To improve the assessment of the extent of damage after storms or due to bark beetle infestation, so-called “change detection” analyses are carried out at the Bavarian State Institute of Forestry (LWF), using Sentinel-2 data.
For these analyses, vegetation indices are calculated, using the spectral reflectance of vegetation. Individual spectral bands are combined to calculate the indices. The result is image data that allows the vegetation and its varying vigour to be recognised more easily.
Depending on the availability of cloud-free Sentinel-2 data, evaluations can also be carried out at short notice to obtain an overview of damaged areas within a particular period. Two examples of current applications for damage detection are presented below:
Bark beetle damage in the Frankenwald Forest
Since 2018, a bark beetle calamity with unprecedented levels of infestation has been causing devastation in the Frankenwald Forest, destroying significant areas of spruce forest. One reason for the rapid spread of the bark beetle is the warm and very dry summers of the years 2017 to 2020. A change detection analysis was carried out to quantify the areas infested by the bark beetle within a certain period. The barren areas that developed in the coniferous forest during the analysis period were also to be identified so that they could be reforested as quickly as possible. Given the extensive areas involved (122,000 ha of forest), the free Sentinel-2 images are well suited to this purpose.
For the Frankenwald forest (ÄELF Kulmbach and Münchberg), a change detection analysis was carried out for the period September 2019 to September 2020 (Figure 3) in order to detect areas damaged by the bark beetle. Theoretically, regular logging operations also cause changes in the spectral information in the satellite data. However, almost no normal timber harvesting operations took place in the Frankenwald forest during this period, due to the bark beetle calamity and historically low timber prices.
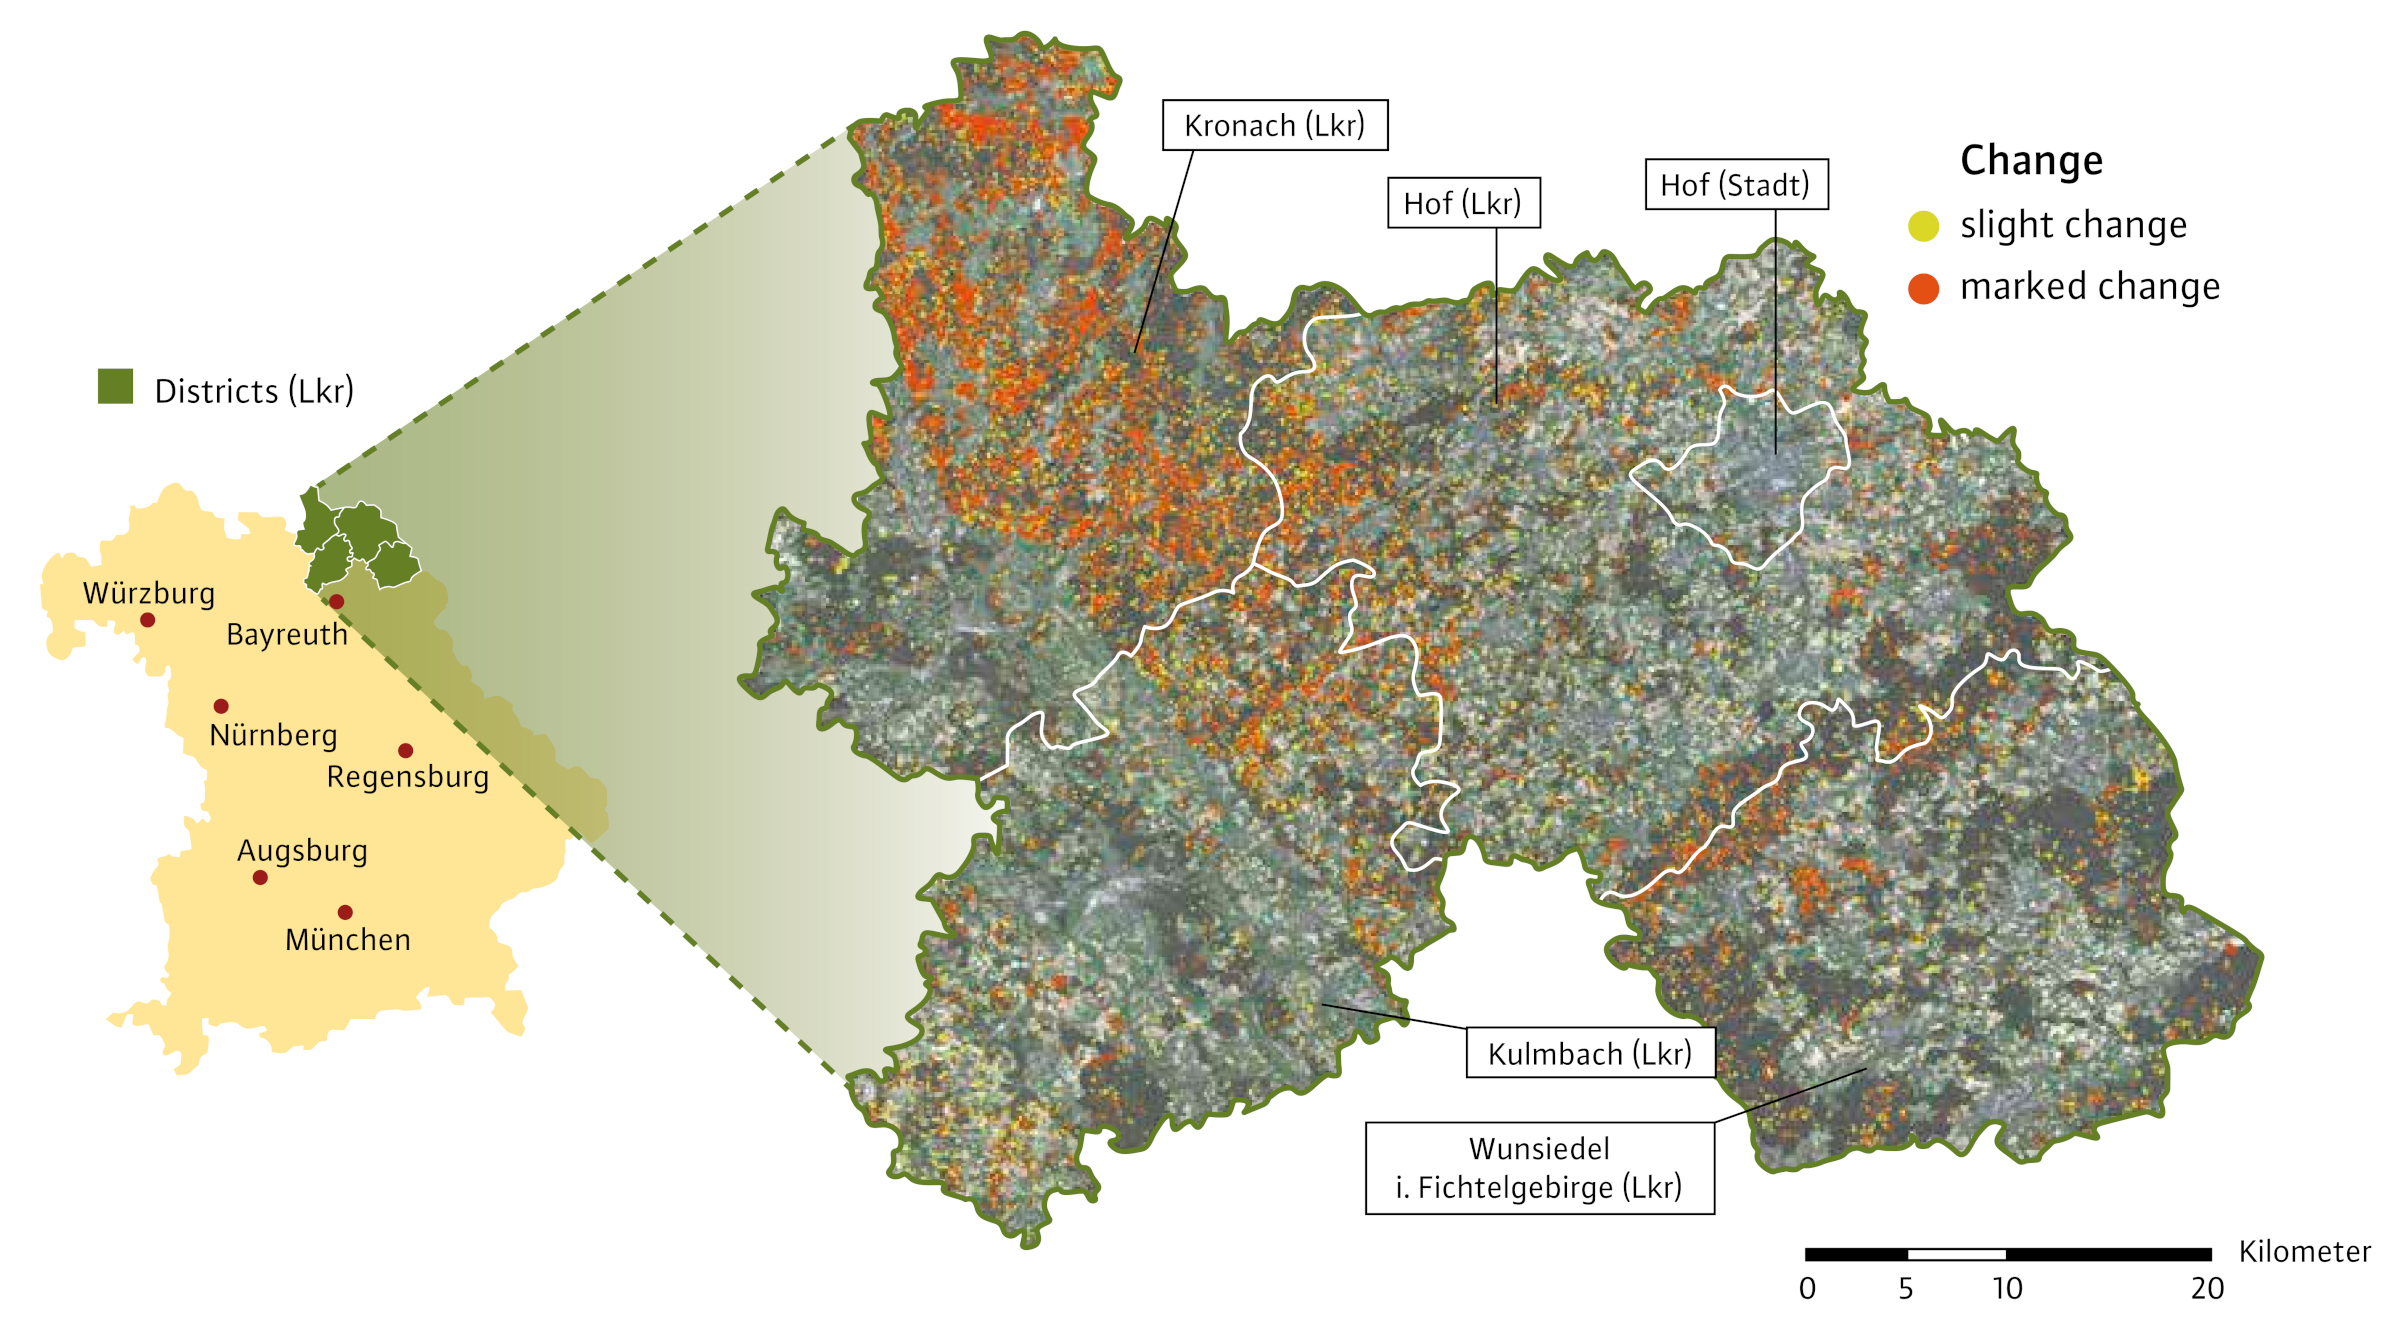
Fig. 3: The enlargement shows the result of the change detection analysis in the affected districts, with the Sentinel-2 scene dated 8 September 2020 in the background. Source: LWF
For the change detection analysis, three vegetation indices with a spatial resolution of 10 x 10 m were calculated for each of the two image recording dates (September 2019 and September 2020). Subsequently, a difference image was derived separately for each vegetation index by subtraction: Difference image = index September 2020 minus index September 2019. The difference images calculated in this way show where the spectral information of the forest areas has changed markedly between the two points in time. This makes it possible to localise weakened and also no longer existing vegetation areas.
Subsequently, the two damage categories “marked change” and “slight change” were defined. The “marked change” category mainly comprises areas where vigorous vegetation was prevalent in the upper layer in September 2019, and where a strong spectral change was established in September 2020. These may be areas of barren ground that have developed, as well as areas with standing dead conifers.
In the “slight change” category, the spectral change is less pronounced - when only individual trees were removed, for example. Areas where there is discolouration of the tree crowns also fall into this category. In some cases, however, areas where the entire overstorey had been removed were also classified under “slight change”, if these areas had a vigorous understorey. Here, the spectral change is less pronounced than in areas without an understorey.
In order to be able to estimate potential amounts of damaged timber in the relevant analysis period at least roughly, the wood stock at the time before the events resulting in damage was also modelled. For this, modelling techniques were used with which existing sample data from a forest inventory can be transferred to the entire forest area using auxiliary information from remote sensing data (especially elevation data).
Storm damage near Rosenheim
On 28 July 2021, a so-called supercell, a very violent type of thunderstorm, caused devastating damage east of Rosenheim over a strip of land about 2 km wide and 10 km long. In order to assess the damage as quickly as possible and to identify potential damaged areas for forestry operators, a change detection analysis was carried out as described above, using Sentinel images from 12 July and 11 August 2021 (Figure 4).
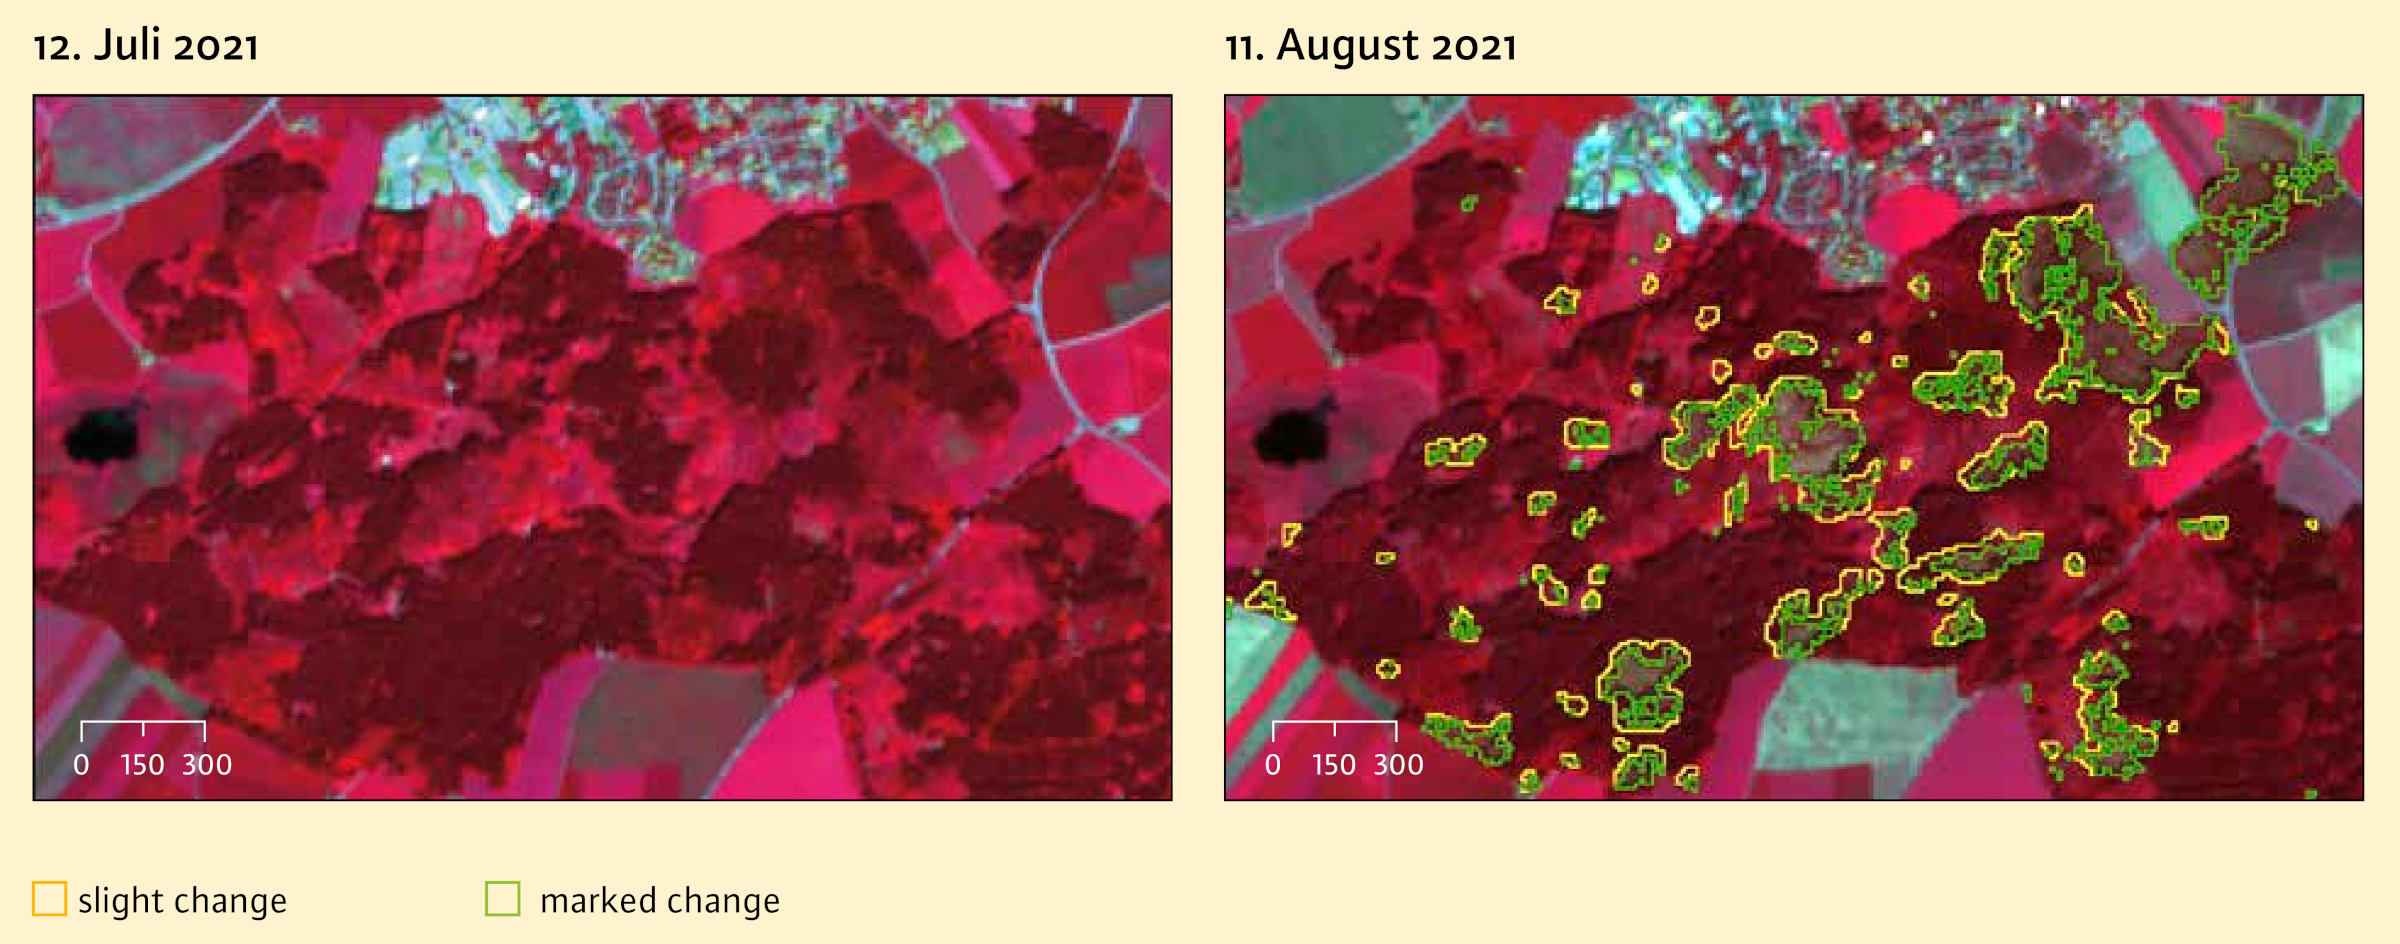
Fig. 4: Left: Excerpt from the Sentinel-2 scene from an area east of Rosenheim on 12 July 2021, as a colour infrared image. Vigorous vegetation appears in different shades of red in this representation. Right: Section of scene from 11 August 2021 overlaid with the results of the change detection analysis. The storm damage can be easily identified from the changes in the spectral information. The areas showing a marked change are shown in green, and areas with a slight change in yellow. Graphic: LWF
Bavaria-wide change detection analysis
In order to analyse changes in forest areas throughout Bavaria, a change detection analysis was carried out over an extensive area using Sentinel-2 data. This covers any changes in forest areas that occurred in Bavaria between autumn 2019 and autumn 2020 (Figure 5). The changed forest areas were separated into coniferous-dominated and broadleaf-dominated forests using the broadleaf and coniferous forest map described above.
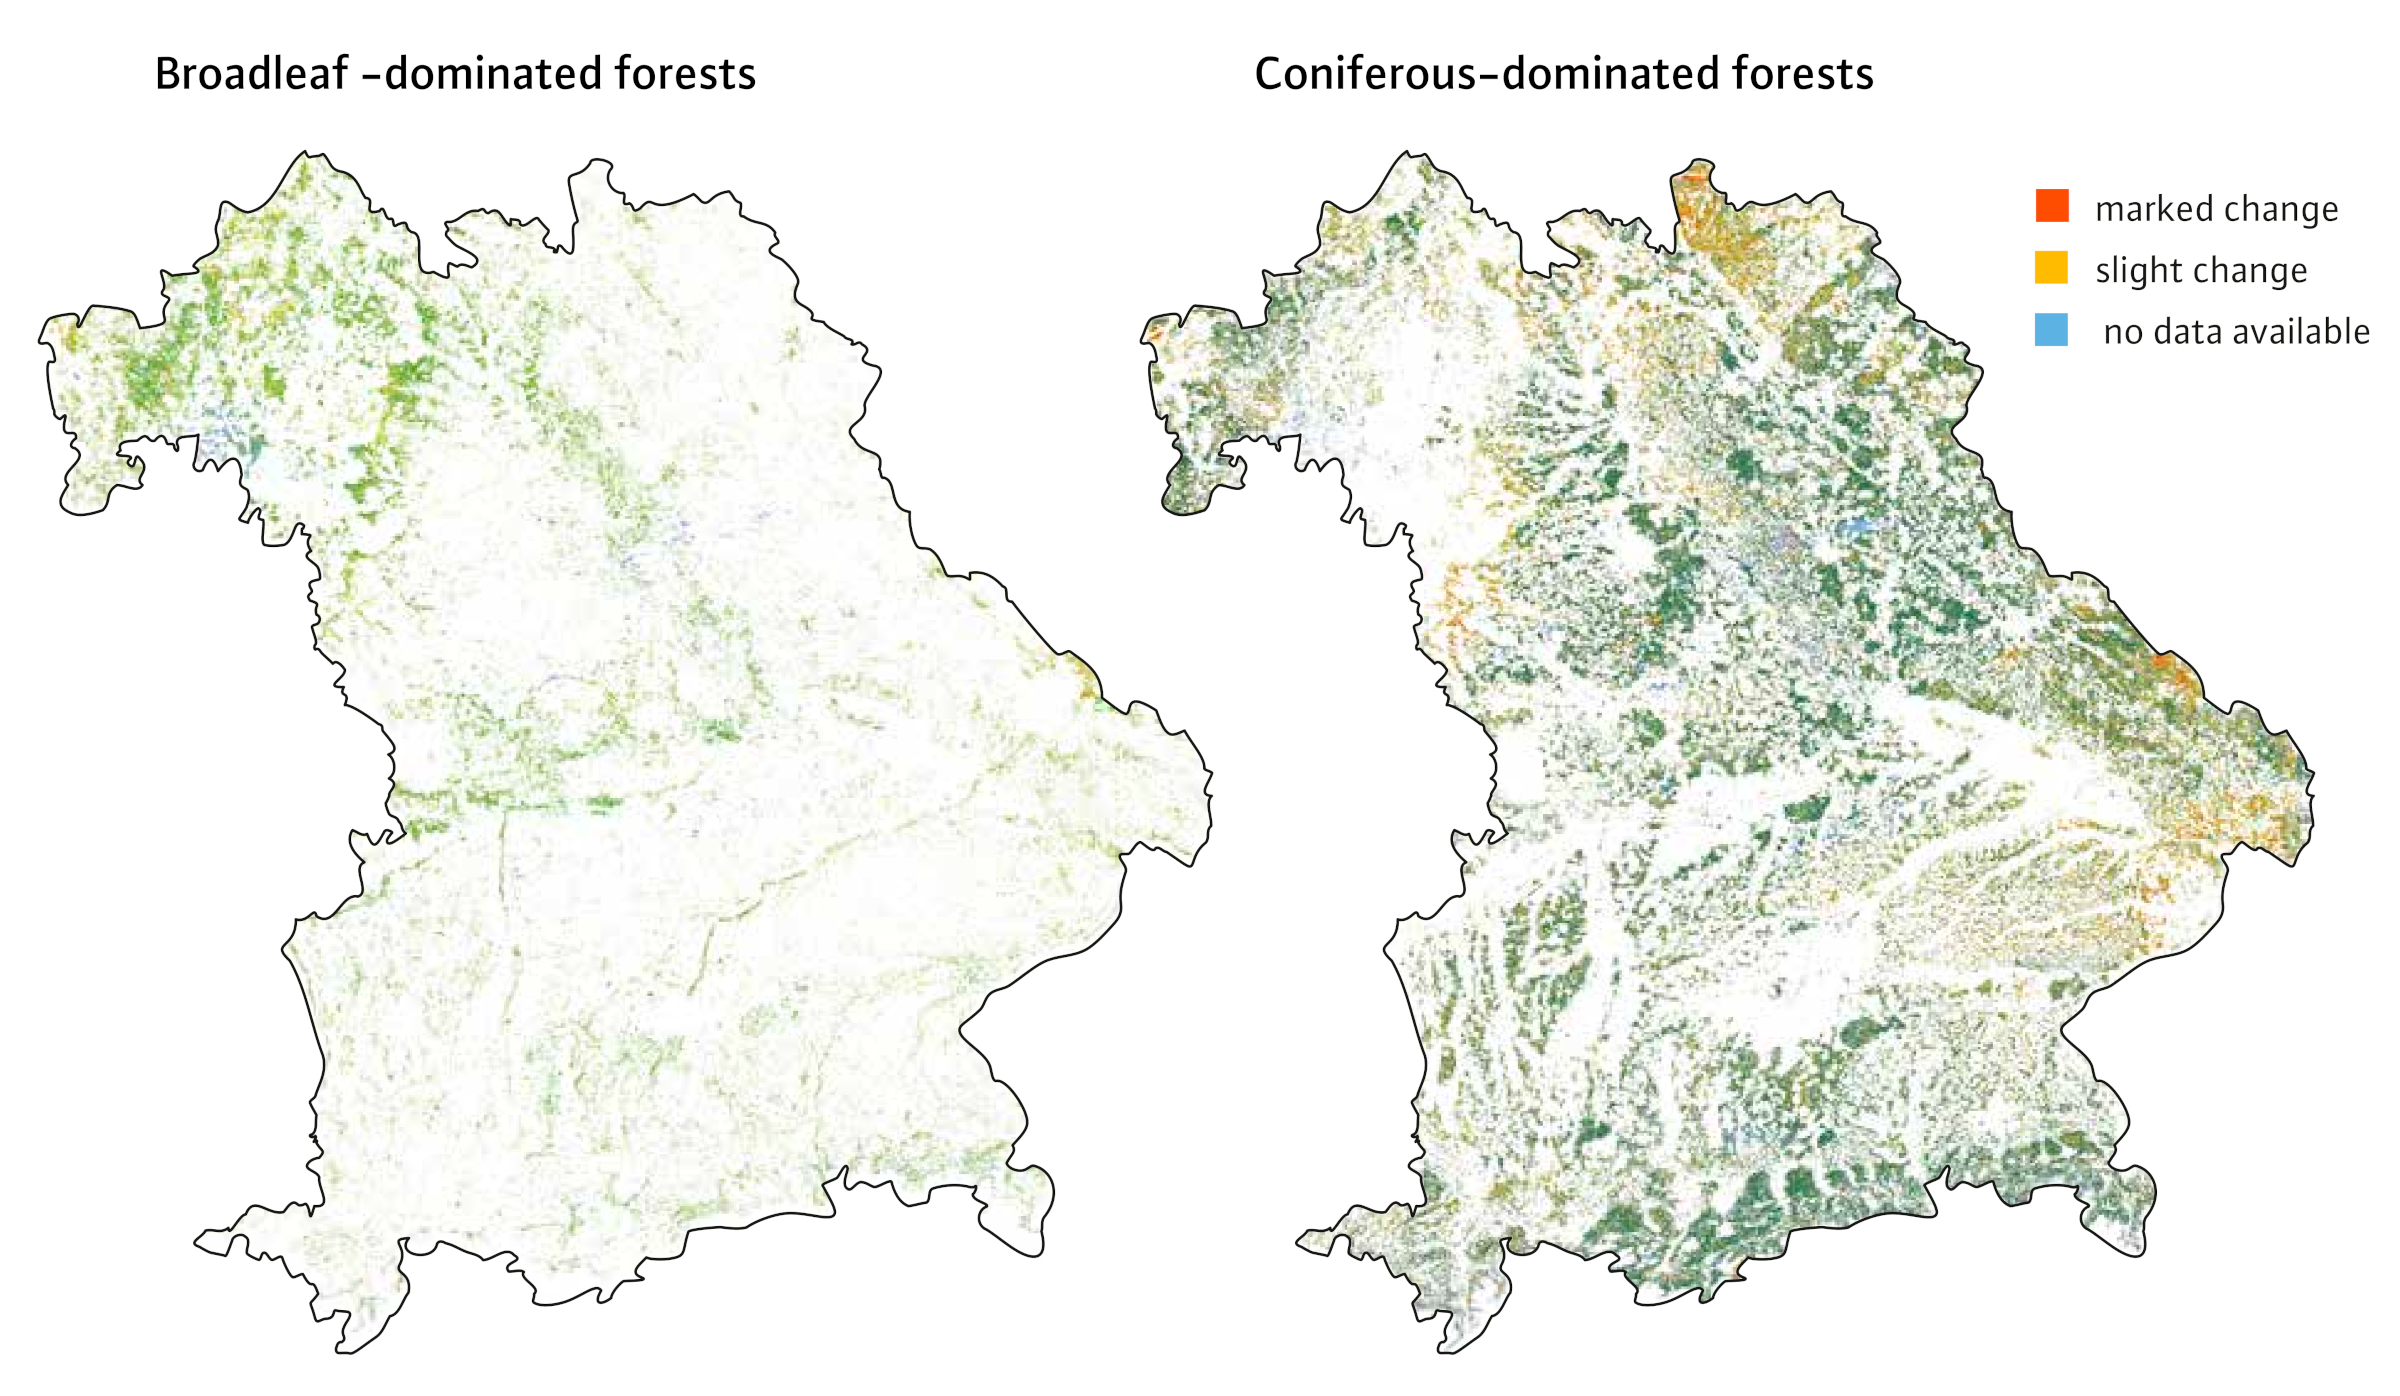
Fig. 5: Location of broadleaf (left) and coniferous forest areas (right) showing a slight and marked change respectively between September 2019 and September 2020. Graphic: LWF
Changes in the coniferous forest were mainly observed in the areas of the Frankenwald forest affected by bark beetle infestation, and in other areas of Lower, Middle and Upper Franconia. In the Niederbayern (“lower Bavaria”) area, changes are also apparent in the coniferous forest, especially in the forest areas damaged by storm “Kolle” in 2017.
There is considerably less large-area change in forests dominated by broadleaf trees, except in areas of Lower and Central Franconia. The droughts of recent years have caused problems especially for common beech (Fagus sylvatica rubra) there, as has the spread in a few areas of the gypsy moth in oak stands.
Applicability for monitoring programmes
The satellite images from Sentinel-2 are also used in various monitoring programmes. In 2018, 2019 and 2020, there was mass propagation of the gypsy moth in parts of the oak forests of Franconia. With Sentinel-2 data, it was possible in 2019 to document the defoliation due to larval feeding from the onset of feeding at the beginning of June, to the resprouting of the leaves at the end of June/beginning of July (Figure 6).
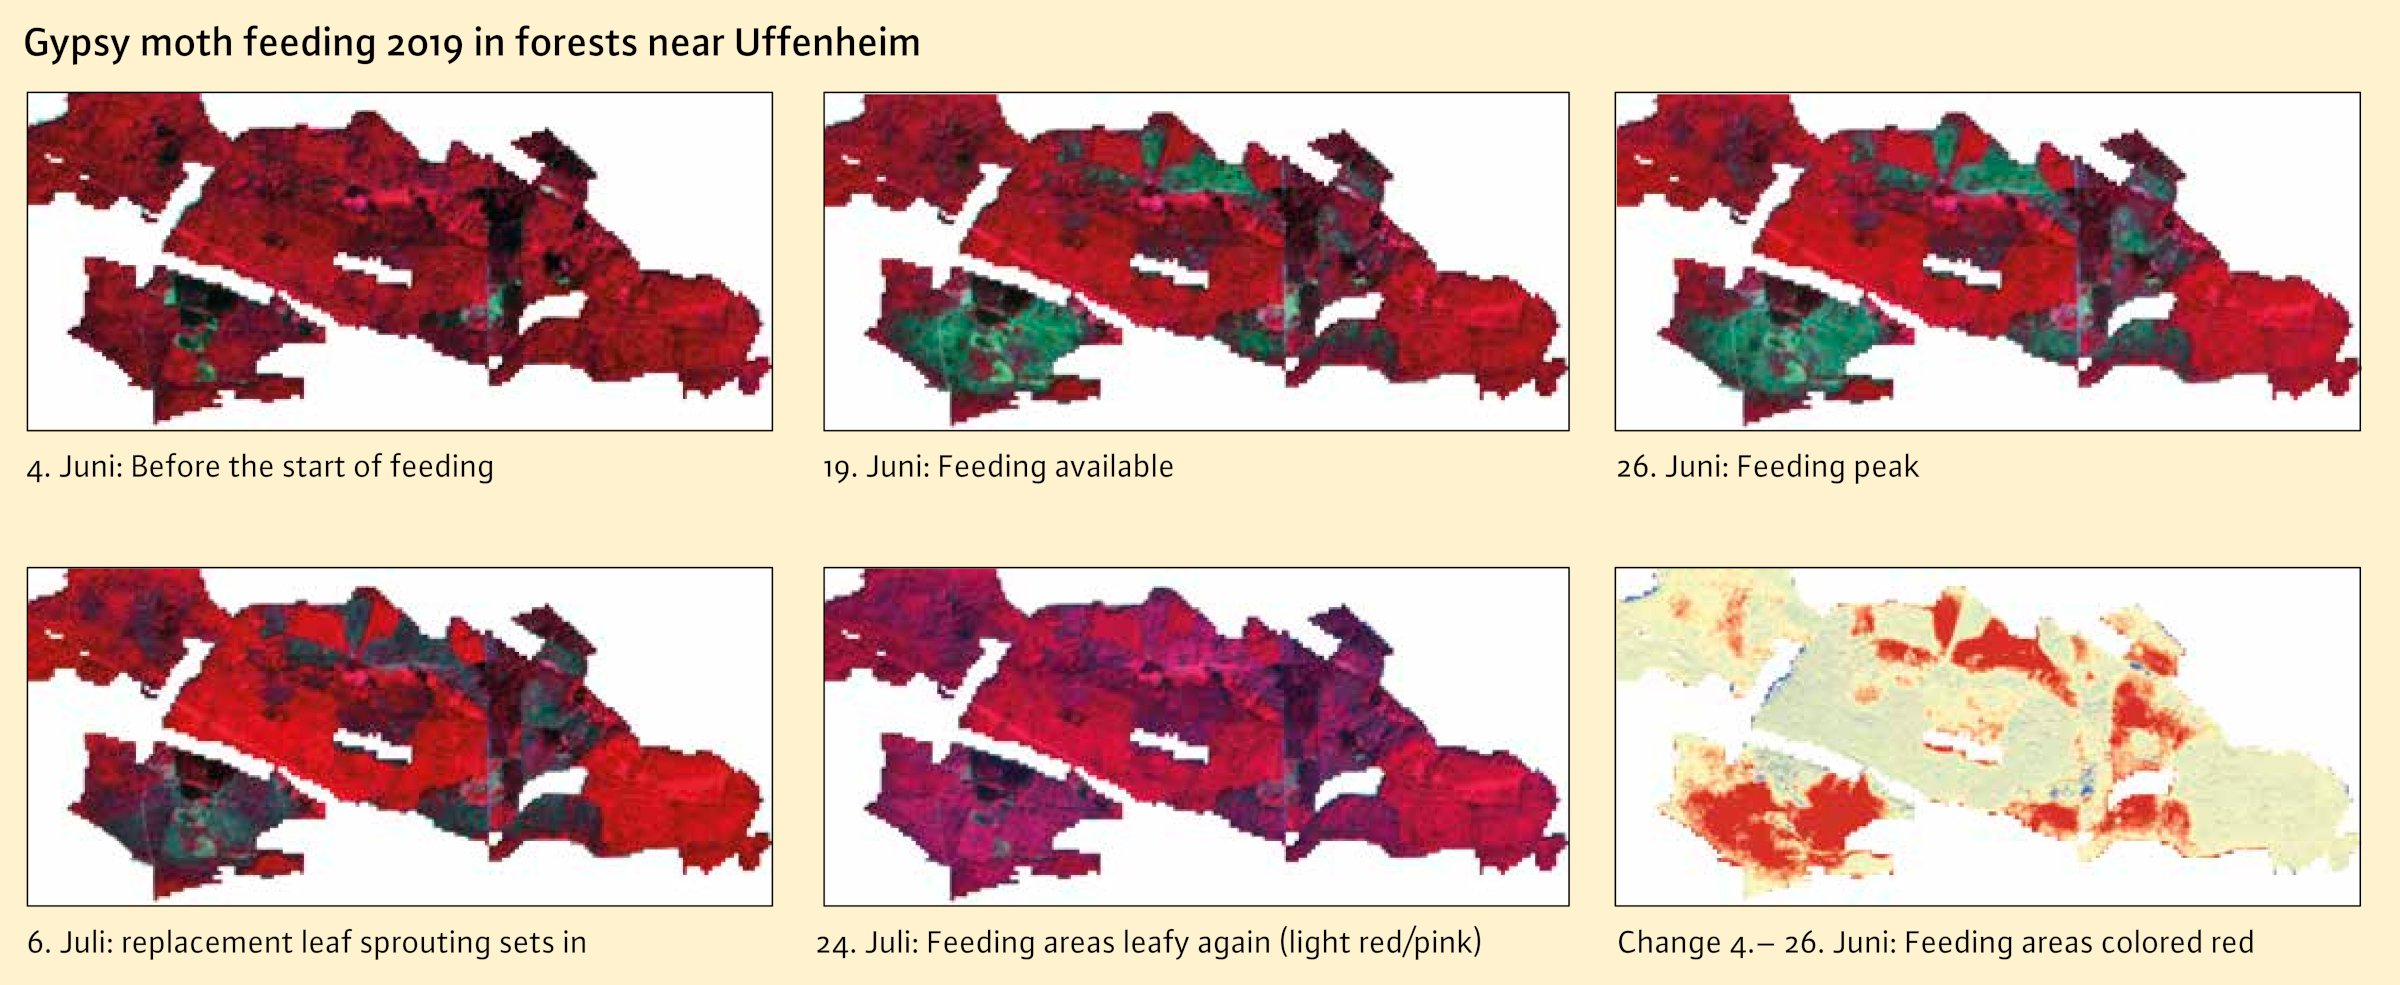
Fig. 6: Temporal change in a forest area shown using Sentinel-2 images (colour-infrared representation) recorded from 4 June to 24 July 2019. Oaks in this area had been defoliated as a result of gypsy moth feeding. Graphic: LWF
One potential use of Sentinel-2 data could be in regular monitoring programmes to detect open spaces or to observe and monitor bark beetle damage. The research project “FNEWs” (Remote Sensing-Based National Forest Damage Assessment System), in which the LWF is involved, aims to create and test what is necessary for the implementation of such a system for large-scale forest damage assessment.
Discussion and outlook
The potential of Sentinel-2 data for the large-scale recording and monitoring of changes in forest areas was demonstrated using examples of individual applications in Bavaria. The maximum spatial resolution (10 m) does not however allow for observations relating to individual trees. For the analysis of individual trees, it is still necessary to refer to aerial photographs or higher-resolution commercial satellite data. The availability of Sentinel-2 images is limited by cloud cover, so an alternative or supplementary source could be Sentinel-1 radar data. These can also be recorded in cloudy conditions, although it should be borne in mind that the processing and analysis of radar recordings is more complex than the evaluation of optical image data.
In future the goal is to carry out nationwide, continuous monitoring of forest areas by means of time series analyses based on Sentinel-1 and Sentinel-2 data, in order to be able to react more quickly to changes in forest areas. The requirements for the implementation of the above-mentioned FNEWs project are currently being examined by a project consortium involving partners from Germany, Austria and Switzerland.

