

Fig. 1. Timber harvesting in the forest; a network of skid trails providing access to the stands is needed for timber extraction. Photo: gremo
A network of extraction corridors reduces the risk of soil damage and damage to the remaining stand to a small area or to a few trees. It is also beneficial for work safety, visibility and efficiency. The careful planning and optimum lay-out of skid trails and extraction tracks provides access to as much forest area as possible, while minimising the driving of vehicles on the area. The planning and optimisation of a skid trail network for extraction is complex. Even one vehicle driving over the area means the forest floor is disturbed. The skid trail network is thus designed to be permanent and used for all further forest operations on the area. After storm events or decades-long periods of forest regeneration without intervention, skid trails can be very difficult to detect in the terrain.
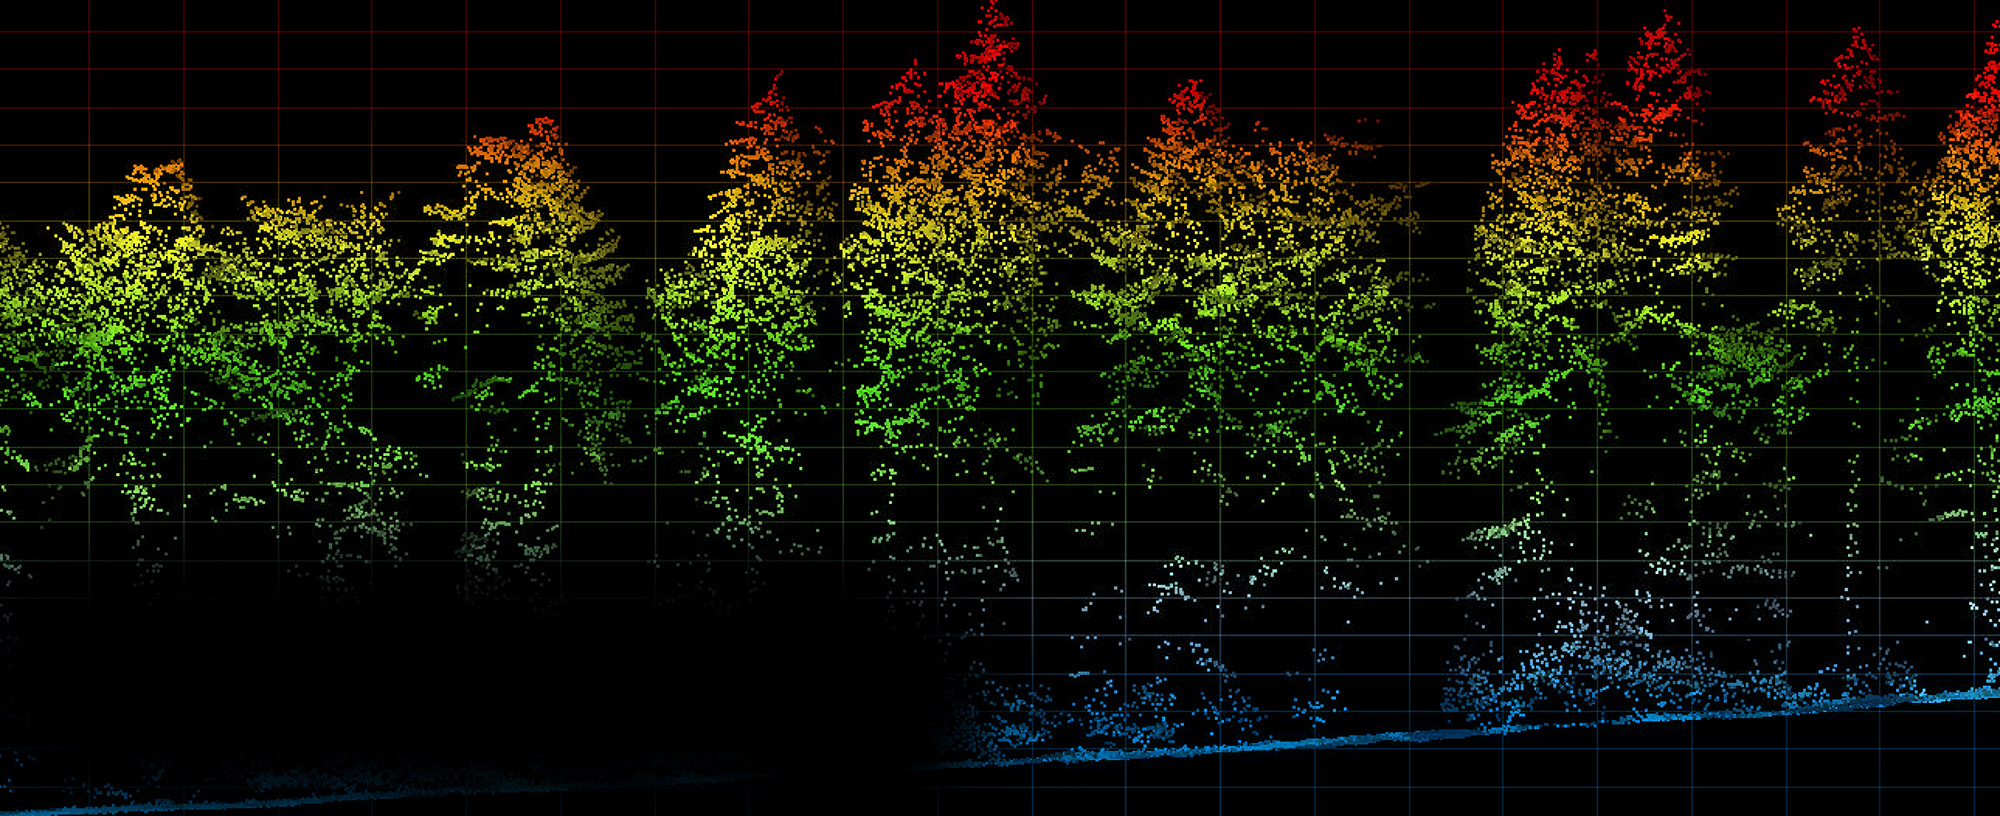
Fig. 2. A cross-section profile can be generated from the point cloud on the basis of the data collected. LiDAR data are measured data that provide a very detailed image of the forest, so that both skid trail networks and tree heights can be read from them. Image: zVg
Skid trails network - digitally recorded
Knowledge of where the skid trails and extraction tracks lie can also be lost when there is a change of personnel. For these reasons, the Forestry Department of the Canton of Aargau recommends the digital recording of the skid trail and extraction track network, and supports forestry enterprises in the carrying out of this task, providing advice and help with the preparation and follow-up of the digital recording, as well as with GPS devices.
The forest roads have already been systematically mapped for the entire canton. They are made available to the foresters in a GIS web application (BKOnline) for planning purposes. The skid trail and extraction track network, on the other hand, has only been mapped on about 40 percent of the forest area.
Prior to 2014, the skid and extraction track network was recorded exclusively with GPS devices in the forest. Since 2014, LiDAR data has been available for the entire canton of Aargau, and GPS recording is supplemented by manual recording on a computer. For this, a digital terrain model (DTM) is calculated from the LiDAR data and then processed so that ground structures are clearly visible.
LiDAR
LiDAR stands for “light detection and ranging”, and is a laser measurement method. It can be used from an aircraft to survey large areas very precisely. The result is a three-dimensional point cloud (see Figure 2), which contains a lot of information about the forest and the ground.
Making ground structures visible
The classical method for making ground structures easily recognisable is the so-called “hillshading” technique. In this, a specific position of the sun is simulated, and then the theoretical shadow cast by the terrain is calculated and presented on a map (Figure 3a). This method has the disadvantage, however, that certain ground structures cannot be seen, depending on the simulated position of the sun (vehicle tracks running parallel to the sun's rays, for example, or vehicle tracks on north-facing slopes if the sun was simulated in the south).


Fig.3 Ground relief maps derived from LiDAR data. Hillshade (a) vs. Aargau method (b).
This is why the canton of Aargau has developed its own method for highlighting ground structures. The “Aargau method” works independently of a simulated sun position and highlights all ground structures evenly (Figure 3b). On this map, the often clearly visible vehicle tracks can be digitally mapped directly. With the help of this map, about two thirds of the skid trail and extraction corridor network can be reconstructed and digitised. This step in the process is very time-consuming, despite the technical aids available today for recording the skid trail network. And: it takes practice to recognise the vehicle tracks.
Model learns to recognise features
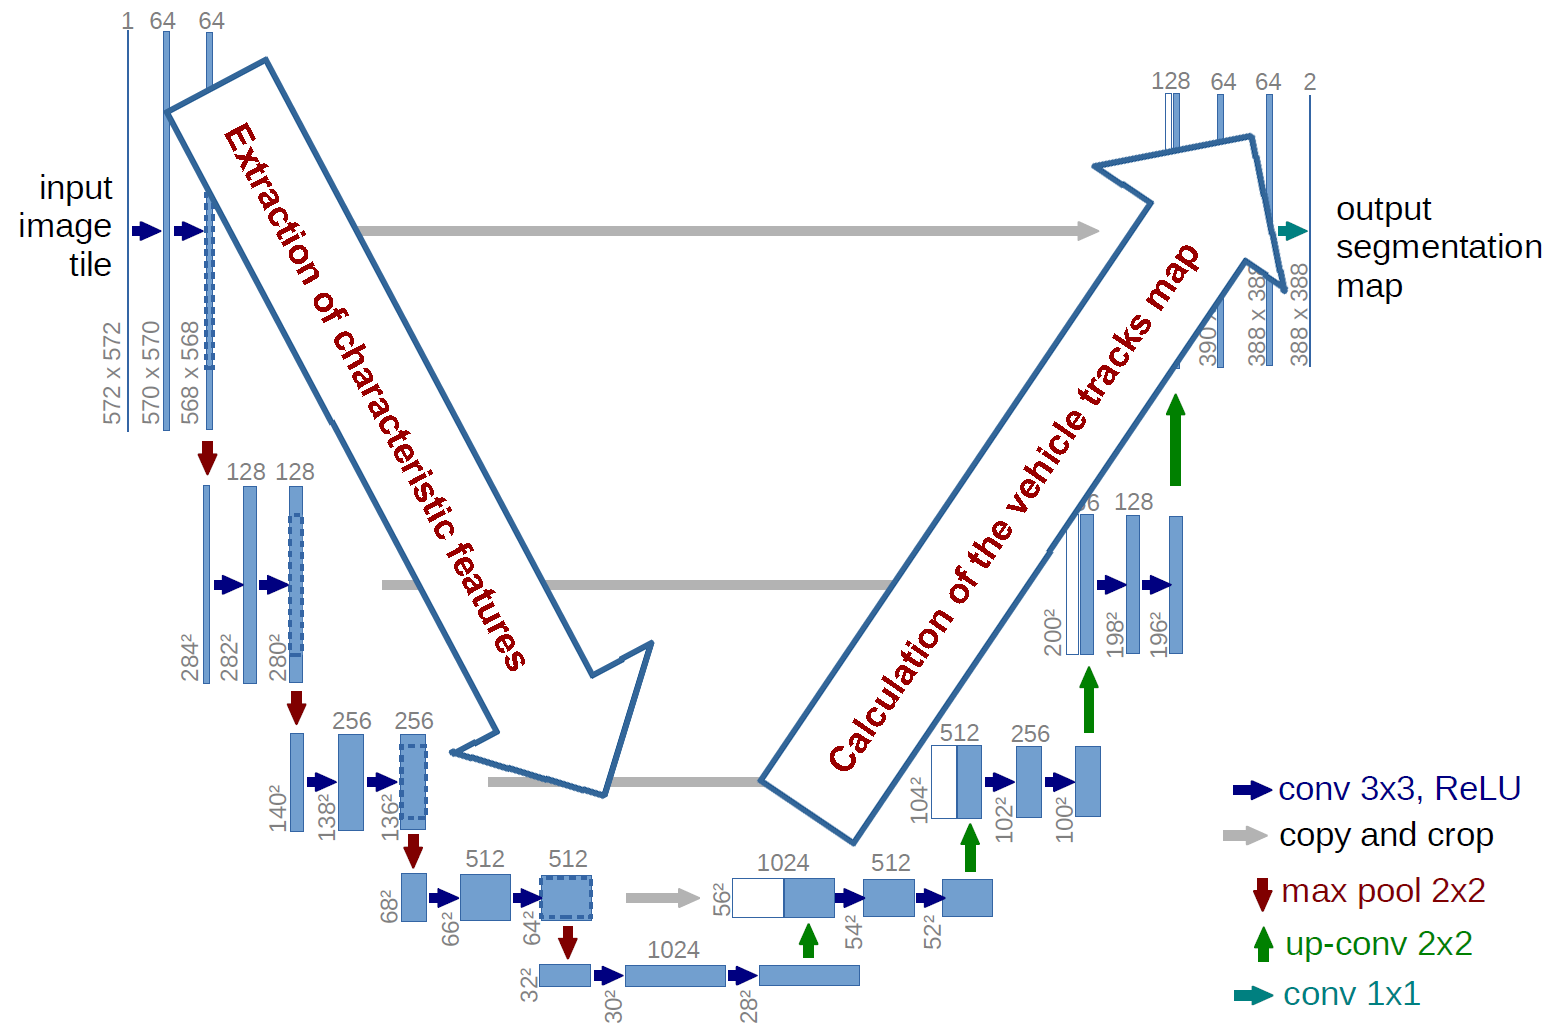
Fig. 4. U-Net architecture, which was used as the basis for the Aargau calculation model (edited, from Ronneberger et al., 2015).
One of the authors of this article, Raffael Bienz, has completed further training in the field of data science at the University of Applied Sciences and Arts of Northwestern Switzerland. As part of his final thesis, he used the available data (ground relief maps and already recorded vehicle tracks) to develop an image recognition model for the automatic detection of vehicle tracks in the previously unmapped forest areas of the canton. For this purpose, an artificial neural network was trained to automatically recognise and mark the skid trail and extraction corridor network on the ground relief map. The basic structure of the model is based on the so-called “U-Net” image segmentation principle developed for the analysis of medical images. It is interesting to note that medical electron microscope images are optically similar to the ground structure maps in LiDAR representations (both are greyscale images).
This could be one reason why the model also worked so well for the LiDAR data. The model is made up of layers and, as the name suggests, has a U-shaped structure (Fig. 4). On the left, a section of the ground relief map (150×150 metres) is fed into the model. Then the network processes the input (left side of the U) and extracts characteristic features from the ground relief map.
These are the features that the model is able to learn and recognise automatically during the training process. The deeper the network goes, the more complex the features that can be detected. In the upper layers, only very simple structures such as lines and edges are recognised. In the deeper layers, very complex structures such as the vehicle tracks can then be recognised.
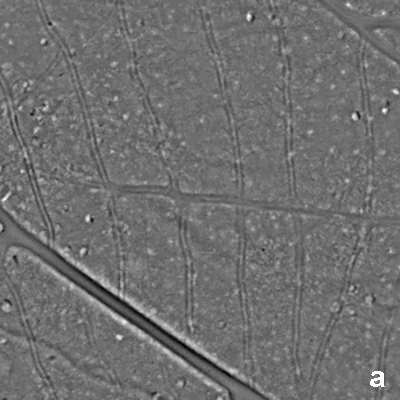
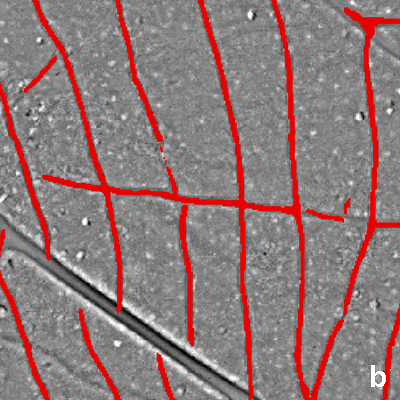
Fig 5. a) Section of the ground relief map (input in model). b) Ground relief map with vehicle tracks mask (model output).
In a second step (right-hand side of the U), the network creates a so-called mask from the recognised features. The mask marks all pixels on the input image that have been identified as vehicle tracks (Fig. 5). This method was used to calculate a map of vehicle tracks for the canton of Aargau. However, the resulting data set was not yet optimal for further use. So that the data set can be further processed and evaluated, the pixel rows have to be converted into lines (from a raster to a vector data set). In a second step, another algorithm was thus developed to vectorise the lines found by the model. This produces a data set that shows the course of the vehicle tracks in pixelated form, independently of the zoom factor (Fig. 6).
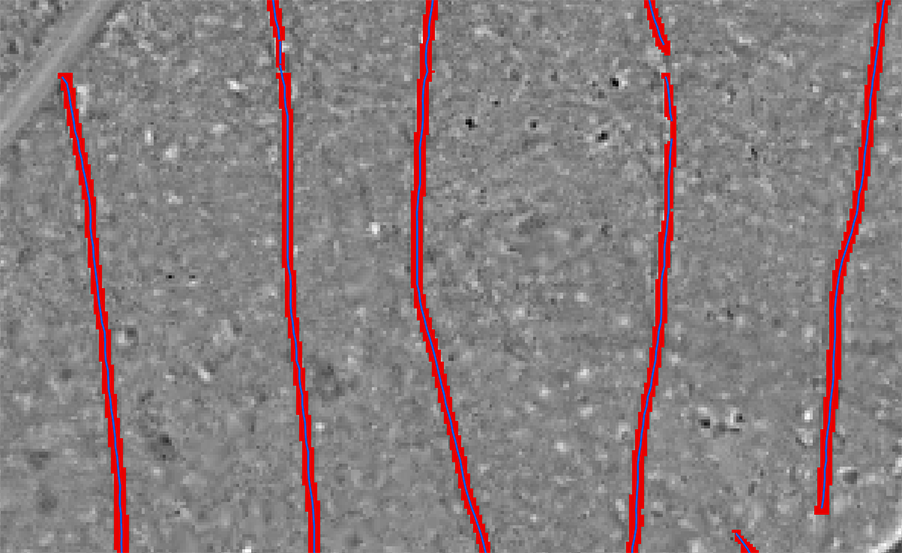
Fig. 6. Vehicle tracks found as a mask (red), and as a vectorised line, shown in blue in this image.
Overall, this method worked very well:
- About 90 per cent of the vehicle tracks visible on the ground relief maps were detected, so that around 126,000 vehicle tracks in the canton of Aargau could be mapped automatically. In a few individual cases, however, the model wrongly classified forest roads or drainage ditches as vehicle tracks.
- The resulting product is already being used successfully as a basis for the recording and optimisation of the skid trail and extraction track network and greatly facilitates the work of the forestry enterprises on the documentation of the network: The recorded vehicle tracks are made available to the forestry enterprises on a GPS device with GIS.
- With local knowledge, a large proportion of the automatically mapped vehicle tracks can immediately be validated as part of the extraction track network.
- Unidentified vehicle tracks or fresh skid trails are then surveyed “conventionally” using the GPS device, and digitised in the GIS.
- This makes it possible to optimise the entire extraction track system.
Once digitised, this definitive extraction track network can be used as a reference for assigning work or creating logging plans. In the case of contractor operations, the data can be sent to the companies in advance on request, and made available to the machine operators via the on-board GPS. The model trained to recognise the vehicle tracks in Aargau is freely available on the internet. Initial tests with Swisstopo LiDAR data from other cantons have shown that it also works well there.
Potential for further analyses
The skid trail and extraction track network data set could have great potential for further analysis. It would be conceivable, for example, to use the data to find and close gaps in the network. Or to evaluate the ideal timber harvesting system for different areas. For this to be possible, however, the skid trail and extraction track network data set would first have to be linked to other data sets (e.g. the forest road network). The canton of Aargau is currently working on this. The model is available on the internet. Initial tests with Swisstopo Lidar data from other cantons show that it also works well there.
The transparent forest
The LiDAR method is also used worldwide for the analysis of forest areas. The Office National des Forêts (ONF) in France has for example conducted LiDAR flights in Haute-Savoie, near the Mont Blanc massif. According to ONF, the data will allow them “to be better able to describe the forests and estimate their value”. Value here is not meant in monetary terms, but in ecological terms. In both Haute-Savoie and in the canton of Aargau, the aim is to collate details on the skid trail and extraction track networks on the one hand, but also to monitor biodiversity, in terms of tree species composition, for example, as well as the consequences of climate change and the state of health of the forest.
For years, various teams of researchers around the world have been working on digitising the forest, not only from the air, but also on the ground. Some also speak of the “transparent forest” in this context. Their goal is to create as comprehensive a “virtual forest” as possible, as a basis for assessment. For this purpose, digital data on trees are collected not only from the air, but also captured by scanners operating on the ground. (hws)
Translation: Tessa Feller