In this paper we suggest a new experimental index for the evaluation of forest naturalness and biodiversity. In order to develop this instrument have been used five markers able to supply representative information about conditions of a forest environment:
- deadwood (N)
- faunistic issues (F)
- climatic conditions (C)
- forest biodiversity, due to populations and continental types (B)
- pressures and stresses which examined environment is subjected to (S)
These have been chosen considering that the only botanic richness necessary isn’t a positive conservation status synonym (and it is, instead, a higher resources availability), fact which could bring to an error during the evaluation of the ecosystem.
The work procedure is based on three different steps: starting from samplings and inventories (for the deadwood) to the monitoring and census (for the fauna), the vegetational aspects and – in the end - the analysis of the historic data sets for the climatic parameter. Once the data have been collected it’s possible to assign scores to every indicator using charts.
The total biodiversity indicator (Tbio) will be given by the summation of the scores obtained by every single indicator: Tbio = N+F+B+C+S in which “N” is the deadwood indicator, “B” is the biodiversity and forestry evaluation indicator, “F” is fauna indicator, “C” is related to climate and “S” is the stress factors indicator. Each indicator value is obtained using 1 to 5 scoring scale, except climate and entomofauna, which scoring scales will be later illustrated.
Deadwood
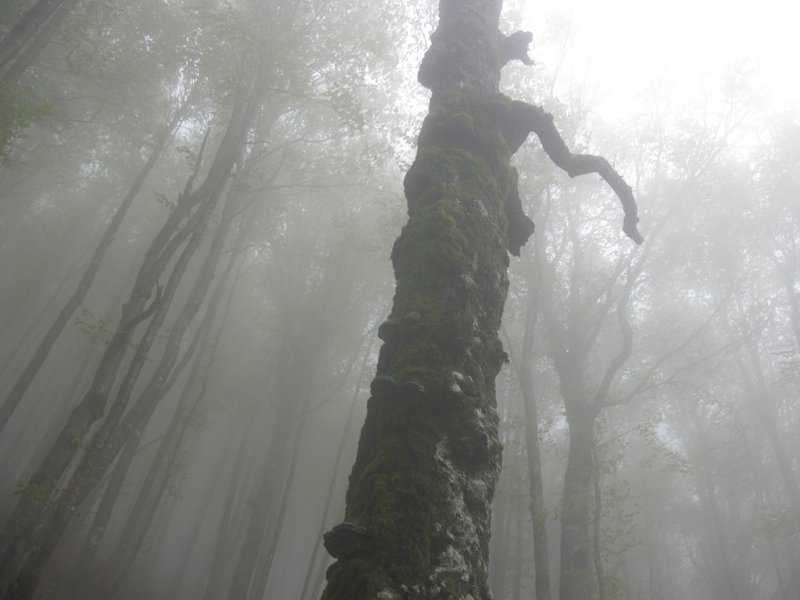
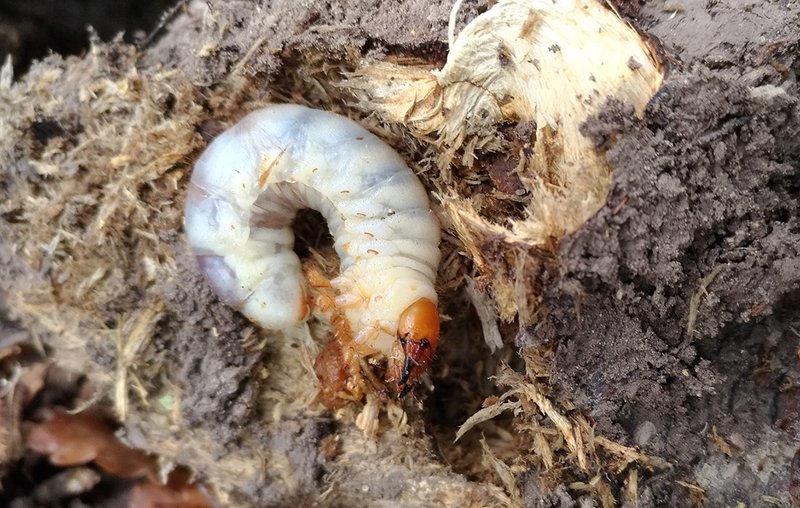
During years the deadwood presence has turned from a bad management index to a signal of sustainable management (in the areas where its presence doesn’t supply forest fire or pest attack risks) in order to bring to a higher naturality. The deadwood importance is due to the environment services that she roles (fig. 2), whether to the habitat that she gives to the detritivore species whether to the trophic network complexity starting from the entomofauna (saproxylic beetles) to the top levels of the food chain, whether to the mycological aspects. Deadwood gives, therefore, an ecological niche in which these species complete their life cycle, whether in part or in its totality (fig. 3).
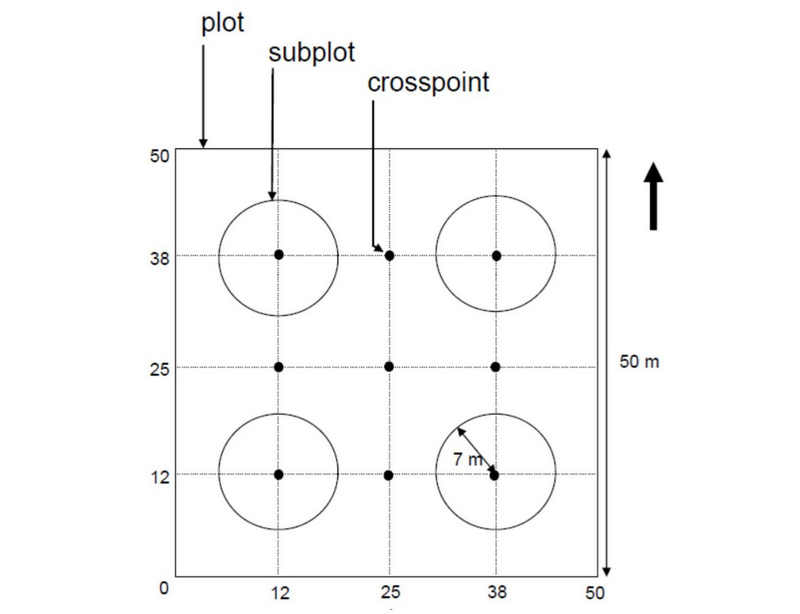
This indicator value is obtained through two steps: in the first one sampling plots and subplots are created (following the Travaglini inventory protocol, fig.4) and a value (or a medium value if the plots and subplots are more than one) is obtained. Then this value or medium value is compared to values already registered for various European forest types to give a final score. Later volumes are calculated.
The final “N” value will so depend on total volume of deadwood esteemed in the study area compared to reference medium value according to the forest type or population in object. The final value is then given by these rules: 1 point if the score is under medium reference values, 2 points if the score is between medium reference values, 3 points if the score is over the medium reference values. Due to the two missing points these can be assigned if the score is the double (one point) or triple (two points) of the medium reference value, bringing the maximum final value to 5. In case of high fire risk areas could be considered one point subtraction.
Wildlife (fauna)
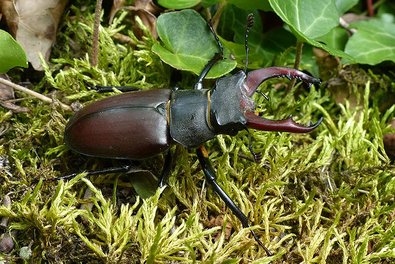
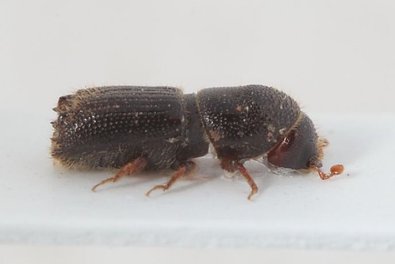
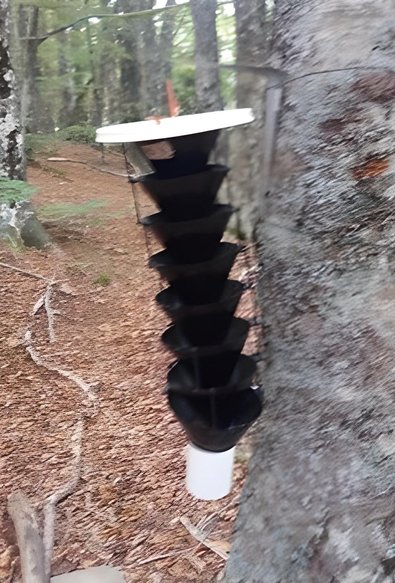
Faunal aspects play a key role which often results ignored and separately considered in the carbon balance of forest environments. A forest environment monitoring and its biodiversity quantification requires careful observation about wildlife. To parameterize fauna (F) in this work we proceed comparing saproxylic entomofauna (Es) (fig. 5) with superior fauna composed by ungulates and similar behavior animals (Fs) at the numerator and the parasitic entomofauna (Sf) (fig. 6) at the denominator, like in the equation here reported: F= Es/(Sf+Fs)
The entomofauna score is based on the presence of protected species and their IUCN evaluation (fig. 7 and 8) or their protection through national or international laws, due a conservation interest (fig. 9). Different case is the one about pests which score is based on their pullulation number in the last 15 years. In this last case must be cleared that some saproxylic species can create damage during their pullulations, therefore a reduction coefficient can be applied (fig. 10).
Instead, superior fauna (fig. 11) evaluation considers impact and population density of ungulates which damage thresholds are growing a lot considering European area, whether in rural areas, whether forest areas. The goal is to obtain a population density value according to the object area evaluating the pressure on which populations and potentially harmful animals can affect, or, analyzing data, to evaluate an environmental improvement for the animal species suitable for that environment.
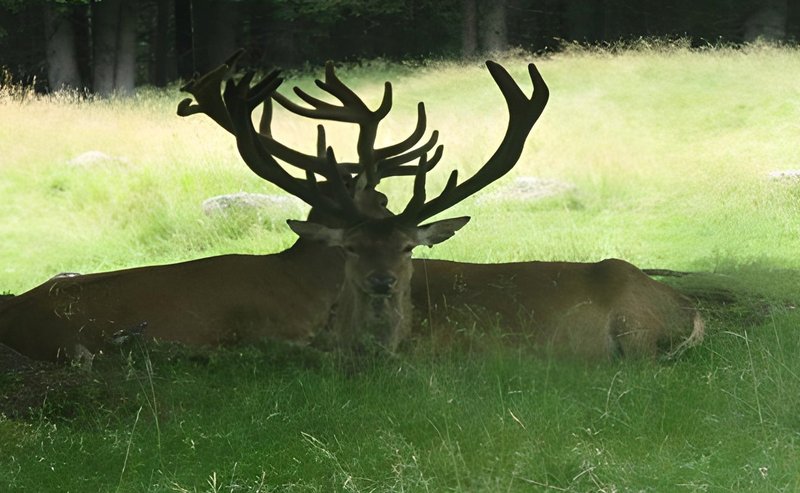
Fig. 11 - Cervus elaphus, Paneveggio. Foto: Lorenzo Tagliaferri
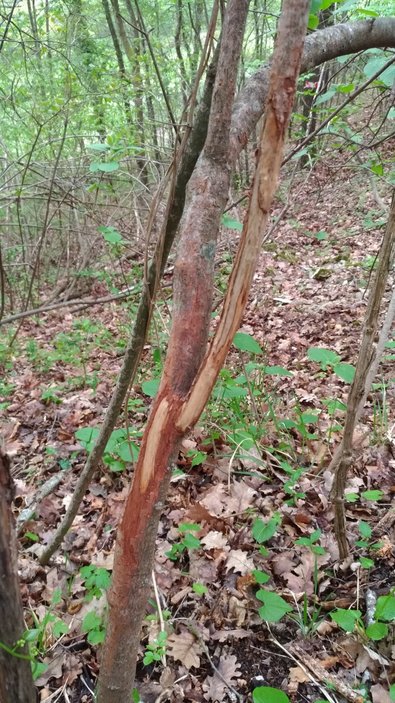
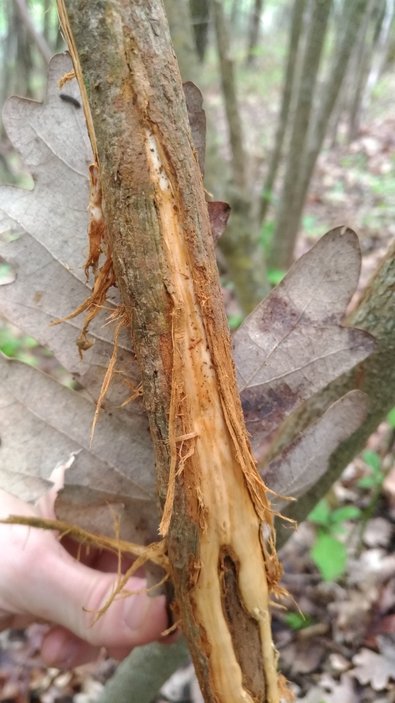
Damages are different and depending on animal or type (behavioral or dietary, fig. 12 and 13). To attribute the score to the warm-blooded fauna are considered: Environmental type; Animal species; Damage type, Density; Damage threshold; Limitation factors. For each parameter has been conceived a score scale, in order to obtain a final score summating all these entries.
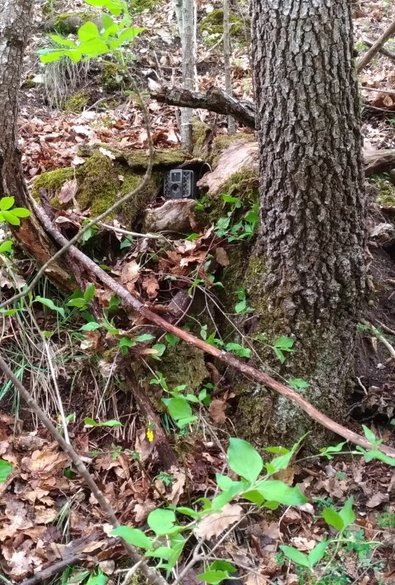
In order to simplify sampling activity the fauna data are collected in the same plots used for deadwood (fig. 14 and 15).
Biodiversity and forestry evaluation
The score assignation to this indicator occurs by the determination on the field (united to the vegetation maps) of the population management (if it’s found) and the resulting complexity, according to develop stage, maturity and population type. Values range from a minimum in areas with naught or poor biodiversity to a maximum in areas with high ecological complexity, using a reference chart which underlines the main biome and then, ecosystems verifiable at national and continental level.
Logically management and rule criterion of the forest area determines complexity grade: low score for coppice ruled forests, higher scores for those converted in high forest with complex undergrowth systems, floodplain areas which can guarantee good deadwood levels, resources for wildlife and so on. Ecosystem types are also divided in two macro categories: natural ecosystems and artificial ecosystems.
Climate factors
Climate has a relevant weight on forest equilibria affecting not only on plant phenology but even on soil dynamics, therefore the climate element plays a role even during the orientation the forestry rules practices. In this case the score is obtained comparing climate classification of the object area, days of fire risk and medium detected precipitations. The climate factor formulation is based on Köppen climate classifications through which is possible to obtain information concerning humidity, precipitations, temperatures and medium temperature changes, all referred to a year; the use of this classification is pretty simple and applicable whether on extensive areas whether small scale areas.
Total “C” value is obtained on the basis of two factors, starting from the climatic zone of reference we’ll so have: average mm of rain and of fire risk days, both obtained from the historian of regional data base on the previous five years mean. Therefore is done a summation with the scores of the object area.
Stress and environment disturbance
The last considered facet in this work is the disturbance inflicted to the environment, evaluating whether disturbance caused by human activities whether those caused by the competition with alien botanical species introduced in the study area, insofar disruptive elements of the natural competition dynamics of local populations (interspecific and intraspecific competition). The choice to parameterize only these two factors stems from the fact that other indicators give – indirectly – a general stress level picture too.
Elements composing this indicator are: wrong forestry practices; governance void for particular functional interest forests; touristic activities disruptions; disruptions caused by infrastructure; illegal activities disruptions (abusiveness, dumps, negligent or arson fire events and so on). All these factors are included into a score chart.
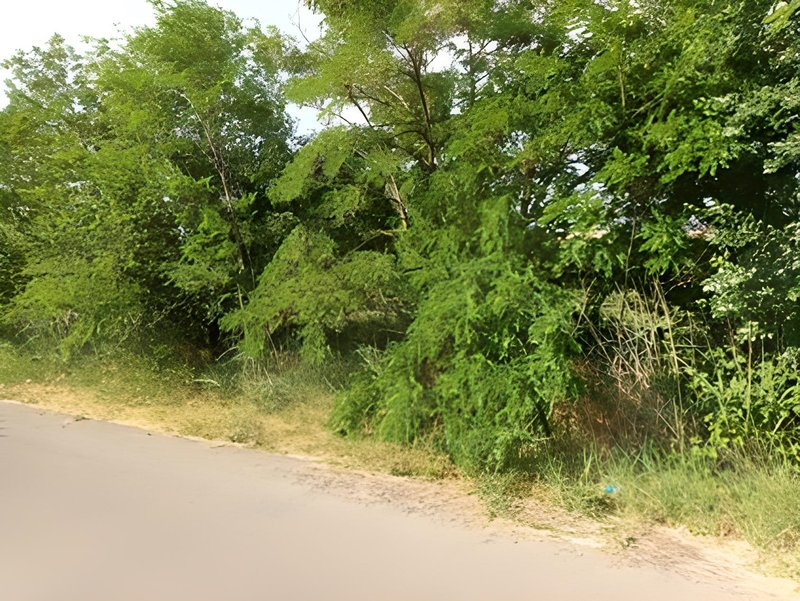
In the second sub-indicator the alien species covering is evaluated, using as reference species Robinia pseudoacacia (fig. 16) and Ailanthus sp. to define the score for other species with analog features (for example higher regrowth, regrowth by sucker or seeding ability and so on). The choice has fallen on these two species because they benefit from a fast growth rhythm and propagation, in strong competition with local plants, causing nutrients subtraction and ground shading. The method used to assign score for this last factor is defined with an esteem of the percentage per hectare on the totality of individuals in the object area. This esteem is done with a fast dendrometric sampling or drone image analysis. The final value will be obtained with a summatory of sub-indicators scores.
Conclusions
The index presented in this paper has been developed in order to give a effective work instrument and to reduce work efforts, operating on precise sampling areas and, so, reducing economic efforts too. In addition, the possibility to employ this methodology in environment monitoring helps to guide the more appropriate governance strategies according to the obtained results, even working on each single indicator.
Also, being this work still in formalization could be useful a collaboration with research institutions working on this sector, testing areas inside Natura 2000 sites (or Emerald network sites in the Swiss Federation) and outside these protected sites, in order to compare the results of this methodology in different European areas, setting potential correction, adjustment and improvement factors.
Translation: Lorenzo Tagliaferri

