


As the effects of climate change progress, the importance of continuous monitoring of our forests is also growing. Extreme weather events, pests and their interactions are posing new challenges. Early detection of stress factors is crucial to ensure that our forests can continue to fulfil their diverse ecological, economic and social functions in the future.
New approaches to assessing tree vitality
Vitality plays an important role when it comes to assessing the condition of trees. It ultimately determines how successfully an organism can thrive and survive under the given environmental conditions. Leaf green, relative leaf size, and foliage or needle condition are the most important parameters for assessing vitality through simple visual inspection. Photosynthesis takes place in the leaves. Leaf mass is therefore an indicator of a tree’s vitality. Accordingly, leaf discolouration and foliage density can certainly be parameters for assessing vitality. In principle, however, the assessment of vitality is a “relative” assessment, i.e. an assessment that is made in comparison with trees of the same species, at the same stage of development, and on similar sites.
In order to regularly assess the vitality of our forests and detect changes at an early stage, the Forest Condition Survey [Waldzustandserhebung WZE] has been carried out annually in Germany since 1984 in the form of a terrestrial inventory taken at fixed points. In the course of the survey, experts visually assess the crown condition of the forest trees from mid-July to mid-August. The key assessment criterion is the degree of defoliation of the crowns in comparison with a fully leafed or needled crown. The deviation from full foliage is estimated in 5 % steps. 0 % defoliation means a fully leafed crown. 40 % defoliation means that, in comparison with a fully leafed crown, 40 % of the leaf mass is missing, or that only 60 % of the normally expected leaf mass is present.
This approach has proven itself and provides valuable time series data. However, disadvantages include the high annual workload and costs for the federal states, as well as the subjective component of the vitality assessment, which cannot be completely eliminated, despite the constant calibration of the experts on training courses run within the framework of the Forest Condition Survey.
In recent decades, the technology of uncrewed aerial vehicles (UAVs) and data analysis have developed rapidly and offer a wide range of possible applications in forestry. These include UAV-based approaches that have been developed to assess the vitality of forest trees. These mainly use the reflectance behaviour of living, above-ground biomass to calculate spectral vegetation indices, which are intended to allow conclusions to be drawn about vitality and its changes over time. However, there is often no clear correlation between reflected radiation and tree species. Furthermore, numerous studies describe changes in vegetation indices over large areas, without scientifically proving a relationship to the state of vitality of the forest areas or individual trees.

Fig.1: A drone flying over a forest area. Photo: Simon Ecke (LWF)
The WZE-UAV project
In the joint project “WZE-UAV” carried out by the LWF and the Weihenstephan-Triesdorf University of Applied Sciences (HSWT), the aim was to use high-resolution drone data to overcome these weaknesses and to develop an objective, cost-effective and operable approach for the regular assessment of the vitality of forest trees. To this end, a DJI drone (P4 Multispectral) was used for the first time in 2020 to fly over 263 of the 314 forest condition survey tracts at 100 m above ground level. It took multispectral images with the spectral bands blue, green, red, red edge and near infrared (NIR), with a ground resolution of 5 cm/pixel (Figure 1). Reusable flight plans were created for this, and the flights were carried out by specially trained drone pilots, covering eight to ten Forest Condition Survey tracts per day. The aerial images obtained were batch processed into orthophotos and digital surface models using the software Agisoft Metashape.
In addition, flights were made on an almost weekly basis over the Freising and Ebersberg forest climate stations during the growing seasons of 2020 and 2021. These used the same technology to investigate the phenological aspect and weather influences on the reflection behaviour and derived vegetation indices.

Fig. 2: Employees of the LWF during the accompanying annual UAV flight over the Forest Condition Survey points in Bavaria. Photo: Tobias Hase, Bavarian State Ministry for Food, Agriculture and Forestry (StMELF)
Data processing
At the beginning of the data processing, the terrestrially determined Forest Condition Survey data, especially the data on crown condition and the tree species, were assigned to the individual tree crowns in the orthophotos. This one-off, time-consuming step was necessary because the terrestrial measurement of the inventory points in Bavaria using GNSS device technology from 2011/2012 under the canopy led to an unacceptable offset in the position in numerous cases. After checking of the position and correction, the crowns of the individual trees in the orthophotos were visually checked and then manually defined.
For further automated processing of the individual tree data, the Python tool “findatree” was developed. This generates image sections of the terrestrially recorded trees using the calculated canopy height model (CHM). These were used in a further step for the species-specific characterisation of the crown condition with the help of the so-called Efficient Network (EfficientNet-B7). This is a Convolutional Neural Network (CNN), a special type of AI model for image classification that can provide good classification results with comparatively low training data availability and computing capacity. The data was separated into training, validation and test datasets. In order to take into account the relatively small number of available images and to avoid so-called “overfitting”, the training data was artificially augmented. The images were randomly rotated between 0 and 360 degrees, and random horizontal and vertical reflections were applied with a probability of 50%.
The quality of the resulting CNN was assessed by comparing it with the needle and leaf loss (NLL) of the terrestrially recorded trees. These were divided into three classes: Healthy trees (0-25% defoliation), stressed trees (26-95% defoliation) and dead trees (96-100% defoliation). A four- and five-part classification, comparable to the approach used in the Forest Condition Survey, was tested but rejected, mainly due to an insufficient number of sample data at the time of project completion. The combination of damage levels with the classification of the main tree species resulted in the final classification into a total of eleven different classes.
Classification by tree species
Figure 3 shows the spectral signatures of one healthy, one diseased and one dead tree at the Ebersberg forest climate station. The value spectrum shows a large range of values, and the progression of the signature values differs between vital, infested and dead trees, particularly in the RGB bands in the optically visible wavelength spectrum. The values presented here suggest that time series are very important in order to minimise the noise in the signature values associated with individual images, which also depends on the lighting conditions at the time of image capture (time of day/cloud cover), and to achieve accurate classification.
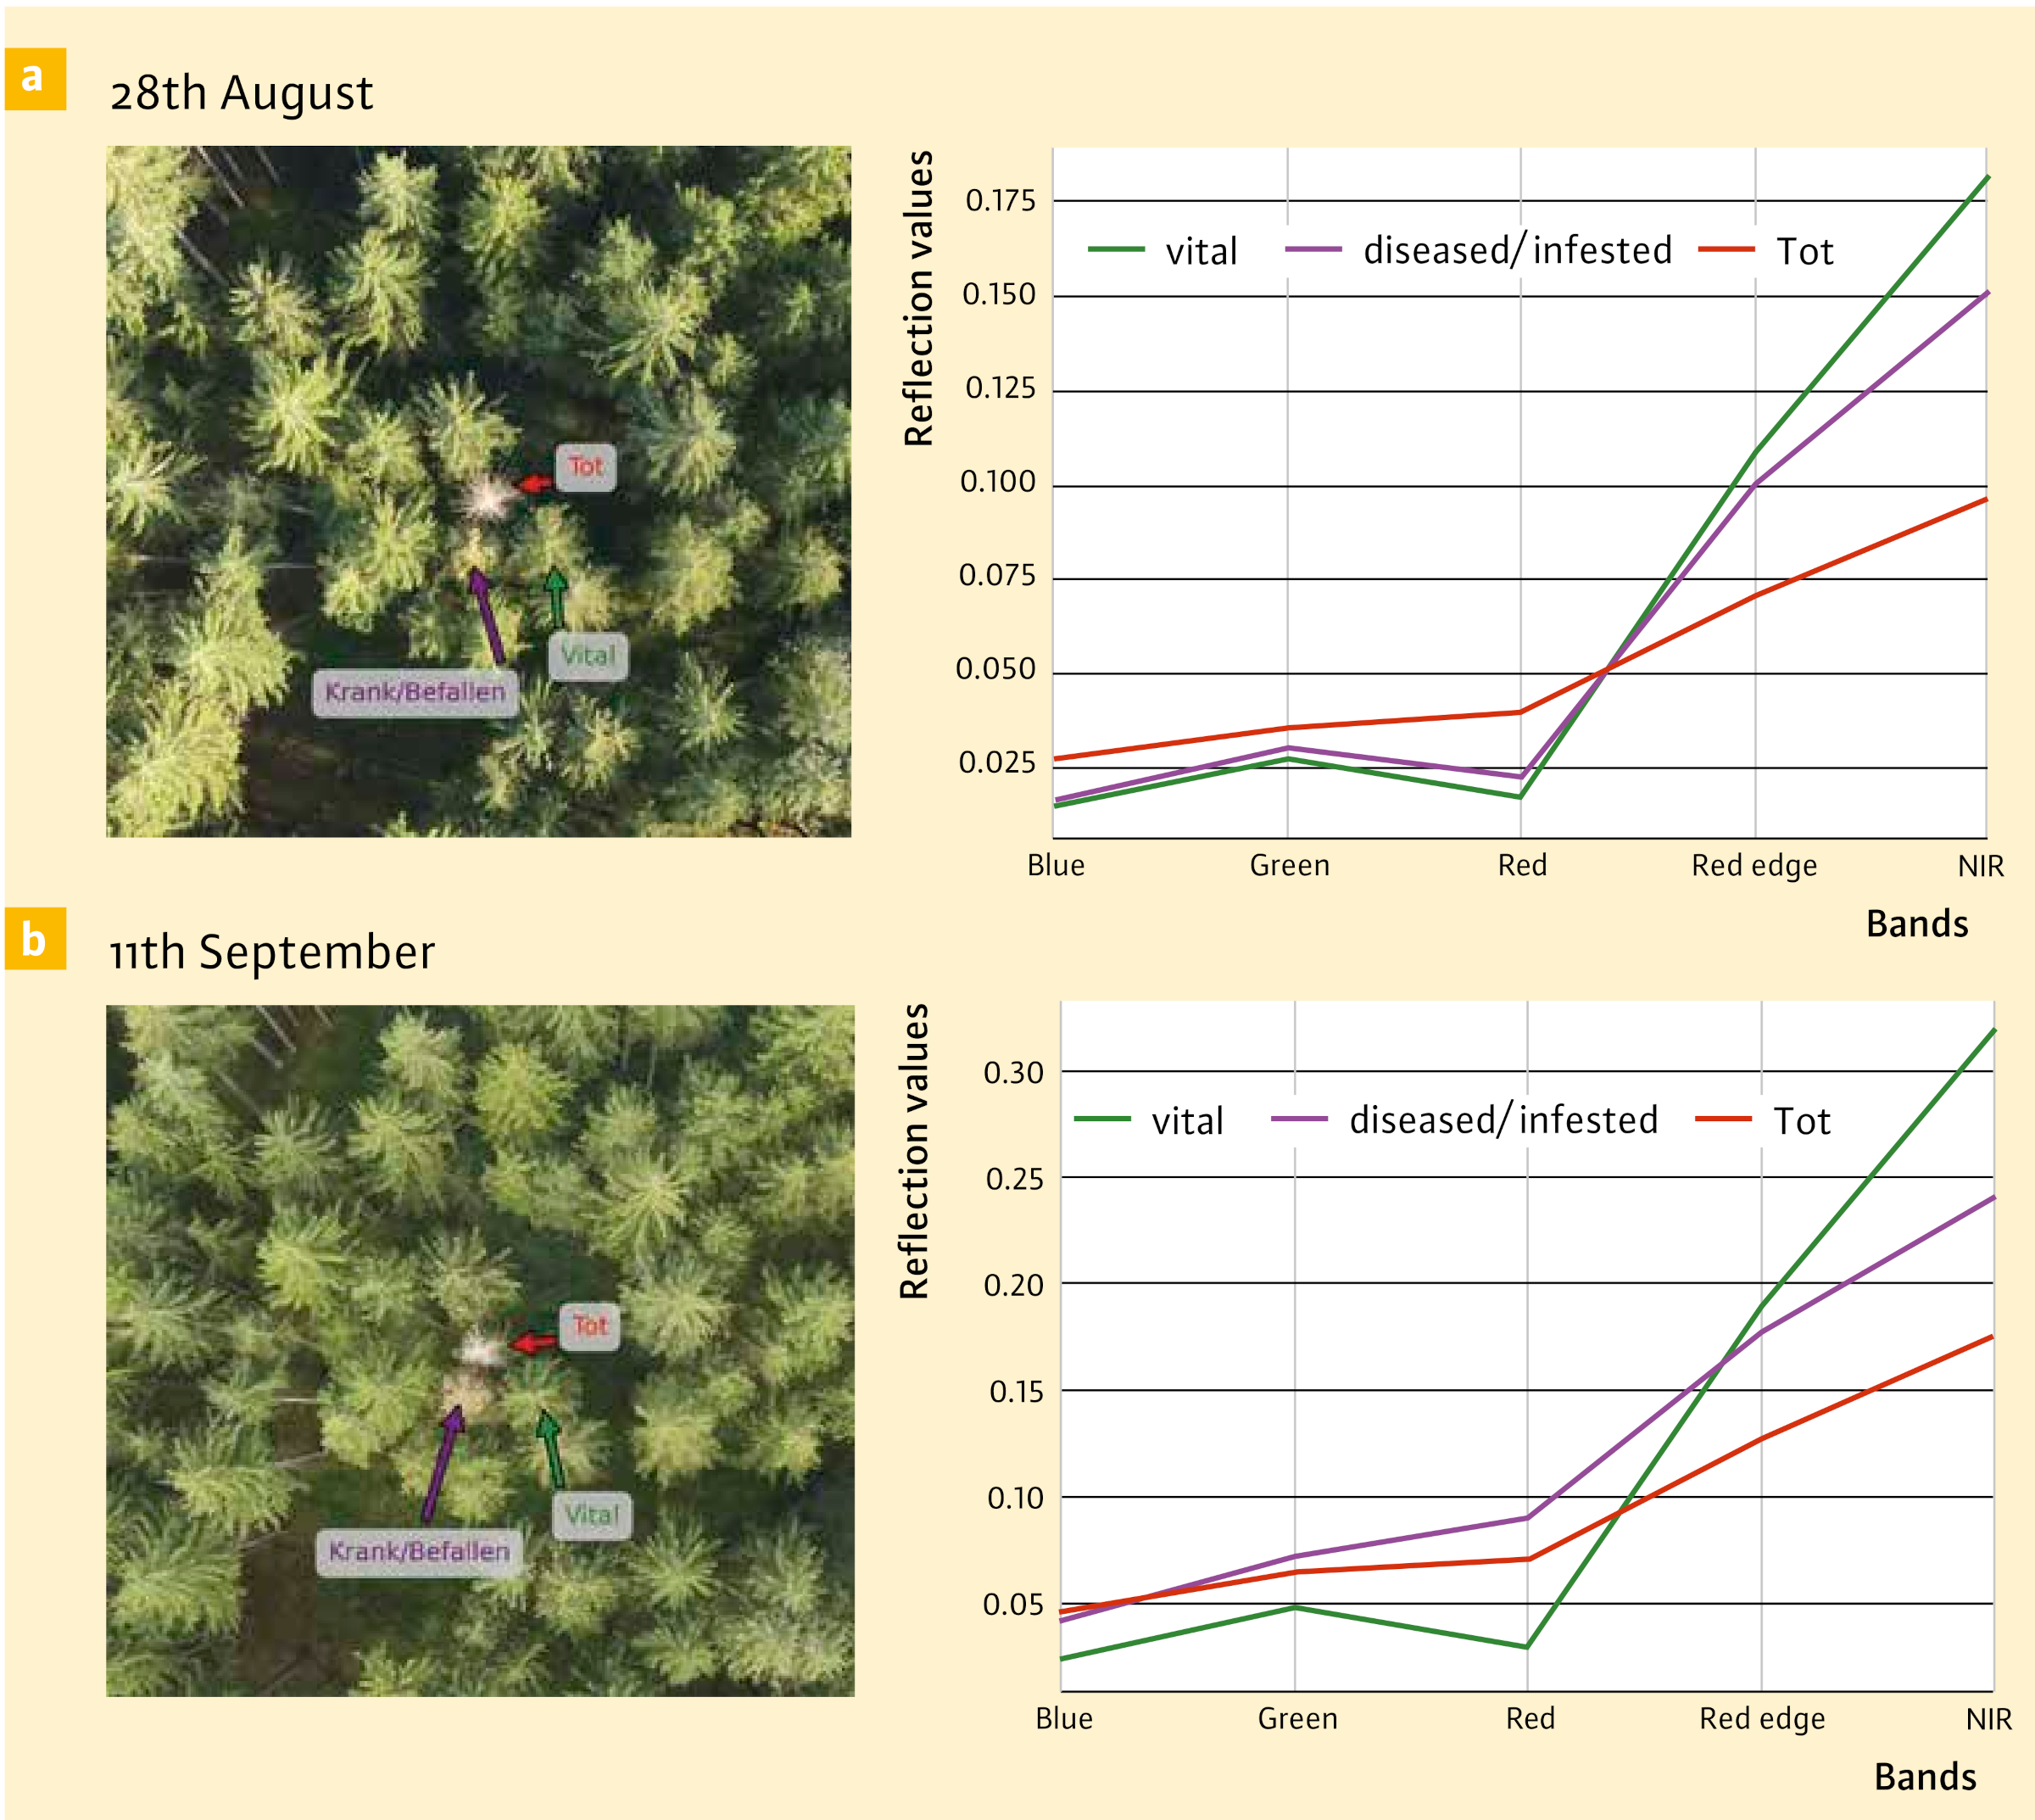
Fig. 3: Orthophoto sections and the corresponding spectral signatures from two flights for three spruce trees at the Ebersberg forest climate station in Bavaria with different vitality levels. a: On 28 August 2020, the infested spruce tree (purple) still appears healthy and the spectral signature does not yet show any clear differences to a healthy tree. b: On 11 September 2020, just under two weeks later, the infested spruce is already clearly discoloured and the spectral signature has also become closer to that of a dead tree.
The statistical analysis of the data of the Forest Condition Survey points was carried out for the main tree species (groups) spruce, pine, fir, beech and oak (Quercus spec). Several vegetation indices (NDVI, NDVRI, GRVI, NDRE) were calculated at individual tree level. These are less sensitive to changing lighting conditions as they utilise relative differences in reflection and are thus better able to compensate for light fluctuations. This proves particularly advantageous when applied to time series datasets, as it allows different recording times to be compared more reliably. Across all of the tree species (groups) considered, it was found that the index values of the vegetation indices correlate closely with the damage levels of the terrestrial inventories and indicate corresponding differences in vitality, with the correlations being more pronounced for spruce, fir and beech than for pine and oak (Figure 4).
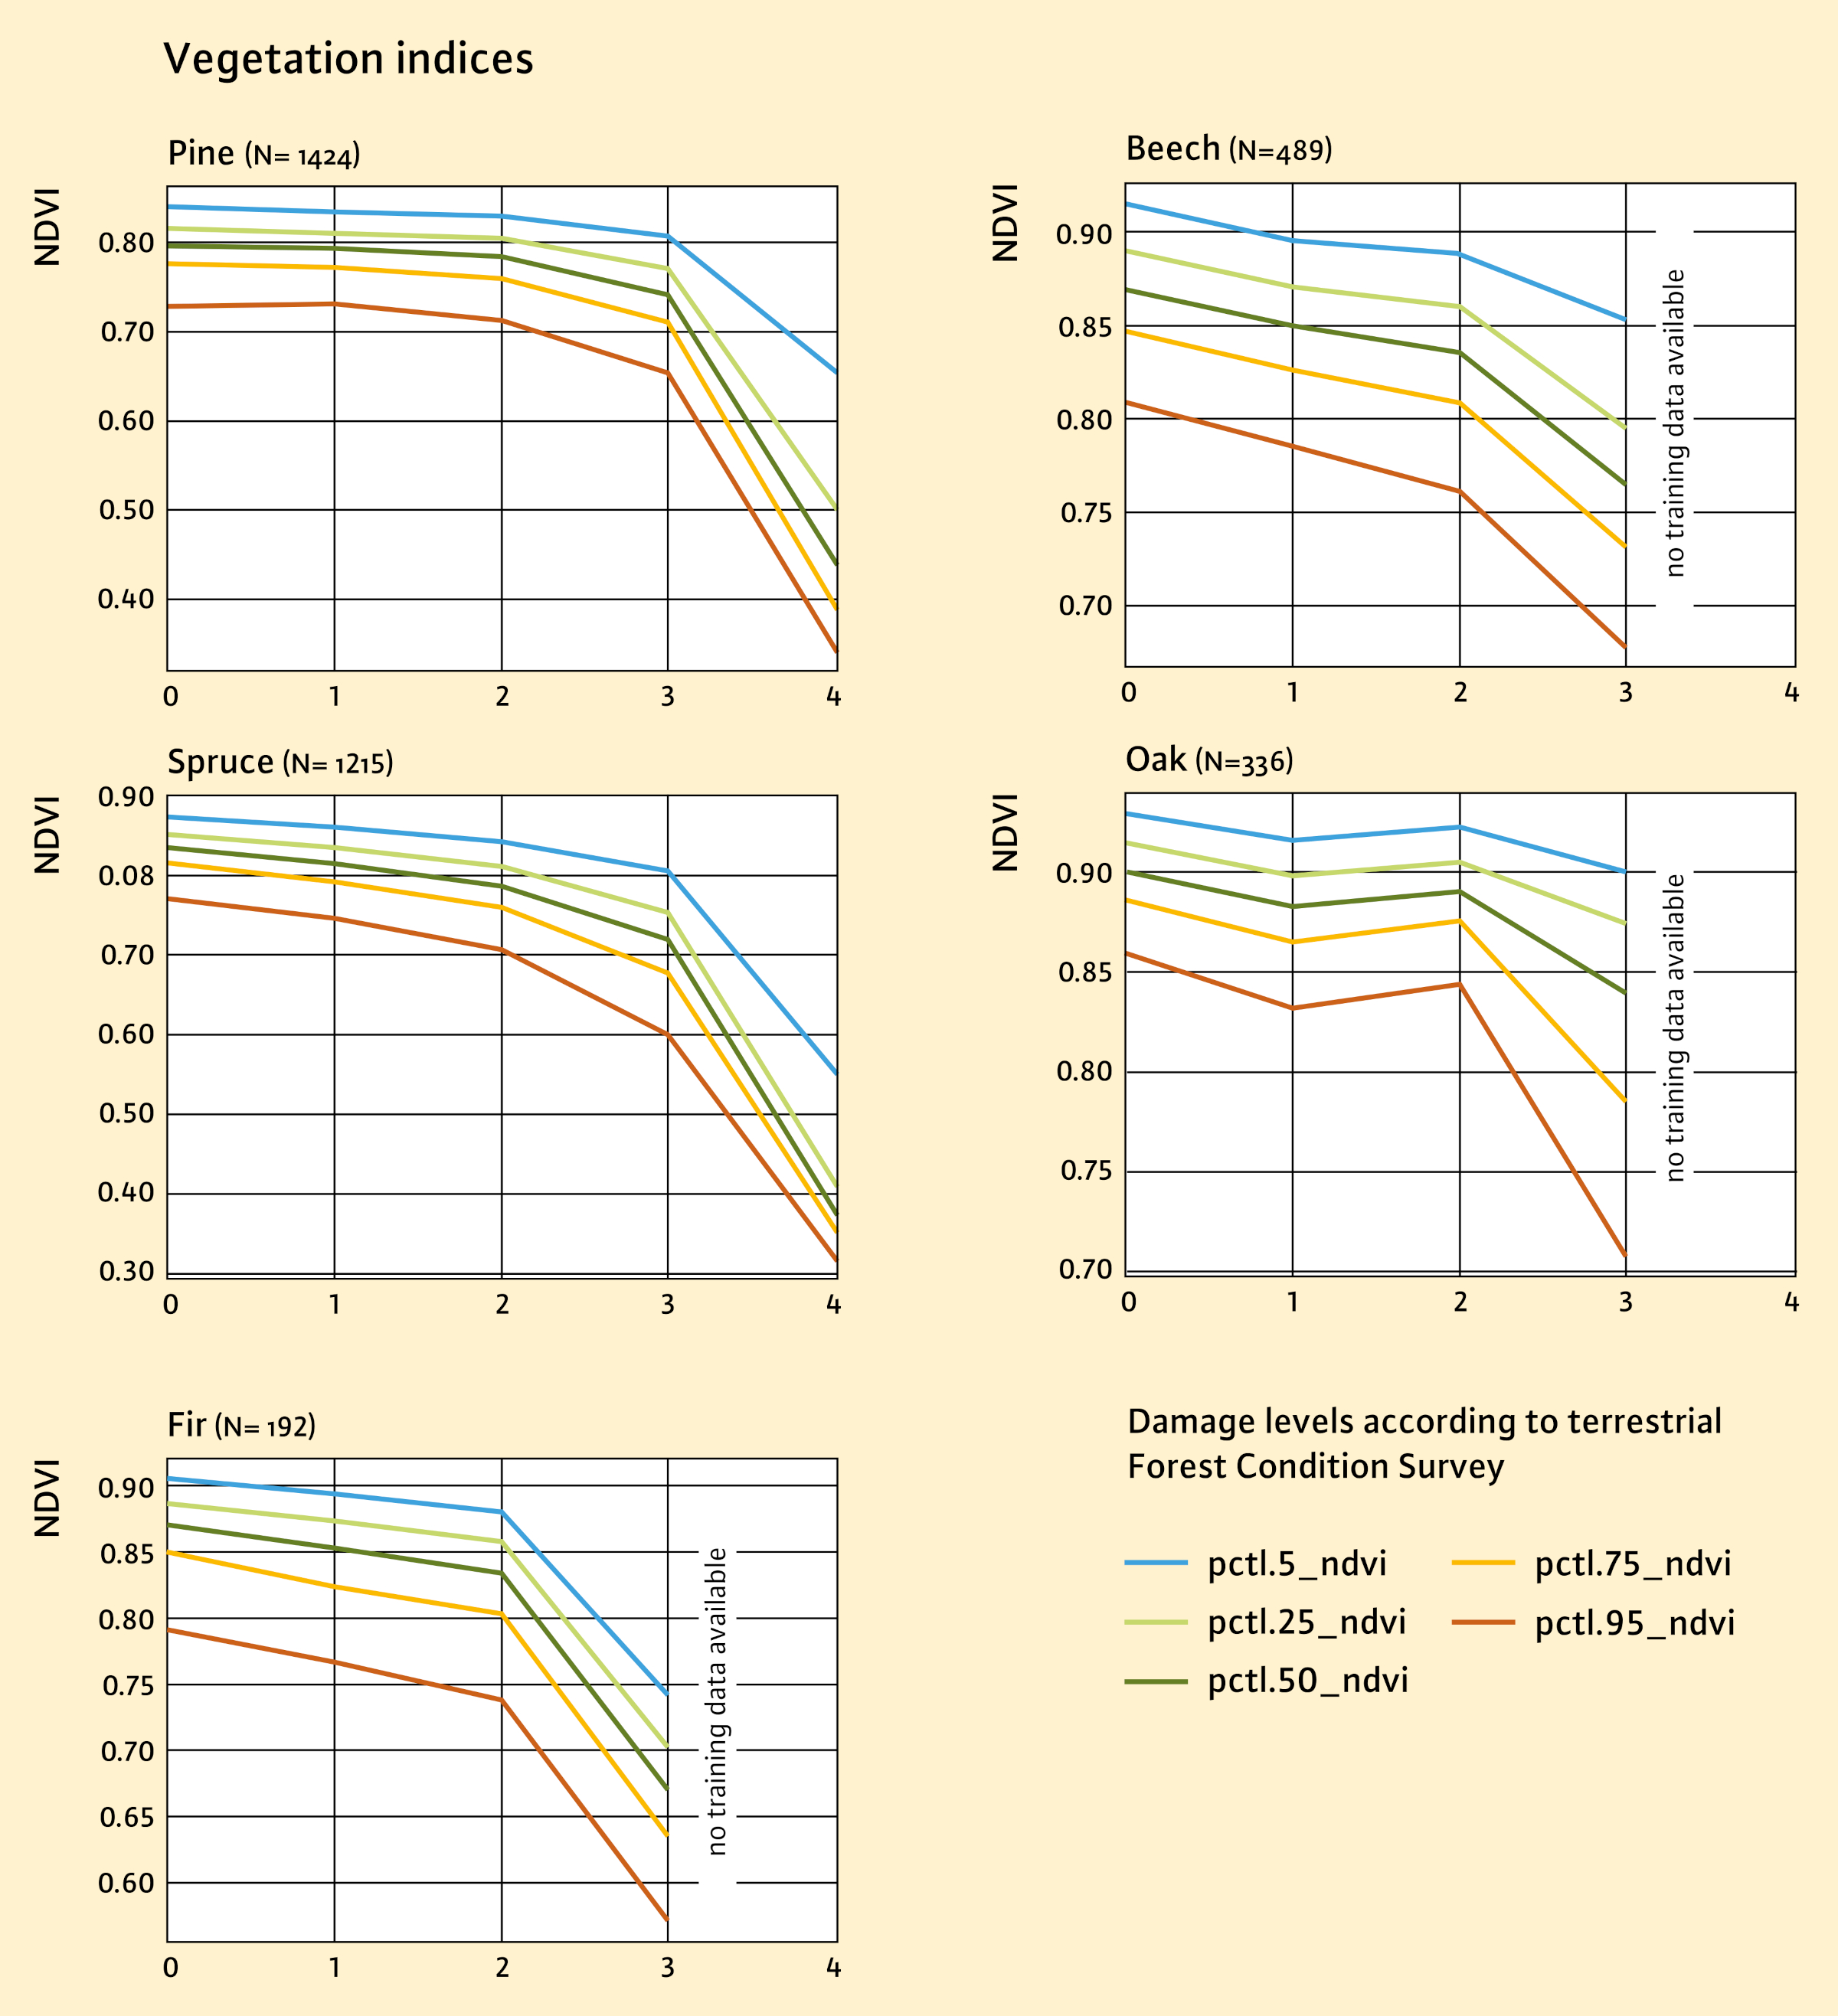
Fig. 4: The graphs show the development of the vegetation index NDVI for the damage levels (SST 0 to 4) of the terrestrial Forest Condition Survey at individual tree level. For each tree species, the progression of the indices is shown in different percentiles (5th, 25th, 50th, 75th and 95th percentiles) to illustrate the distribution of vegetation values at different stress levels. In most cases, the values of the vegetation indices decrease with increasing damage level, indicating a deterioration in vitality. The severity of these changes varies between the tree species, with spruce and fir for example showing greater decreases in index values than pine and oak. The percentiles also illustrate the variability within the index values at the different stress levels. Furthermore, it becomes clear that the various vegetation indices react differently to the damage levels depending on the tree species.
Using the high-resolution UAV data with all five spectral bands (R-G-B-RE-NIR), it was possible to automatically classify the species spruce, fir and pine as well as beech and oak with very high accuracy according to the parameters of tree species and level of vitality. When the vitality level was taken into account, F1-scores between 0.51 (pine healthy) and 0.81 (spruce healthy) were achieved (Figure 5). Dead trees could be distinguished very accurately with an F1-score of 0.97. If the vitality parameter was not taken into account, the F1-scores were between 0.77 (fir) and 0.95 (spruce), which are good classification results (Figure 6). The authors refer here to Ecke et al, (2024) for more detailed insights into the results presented here.
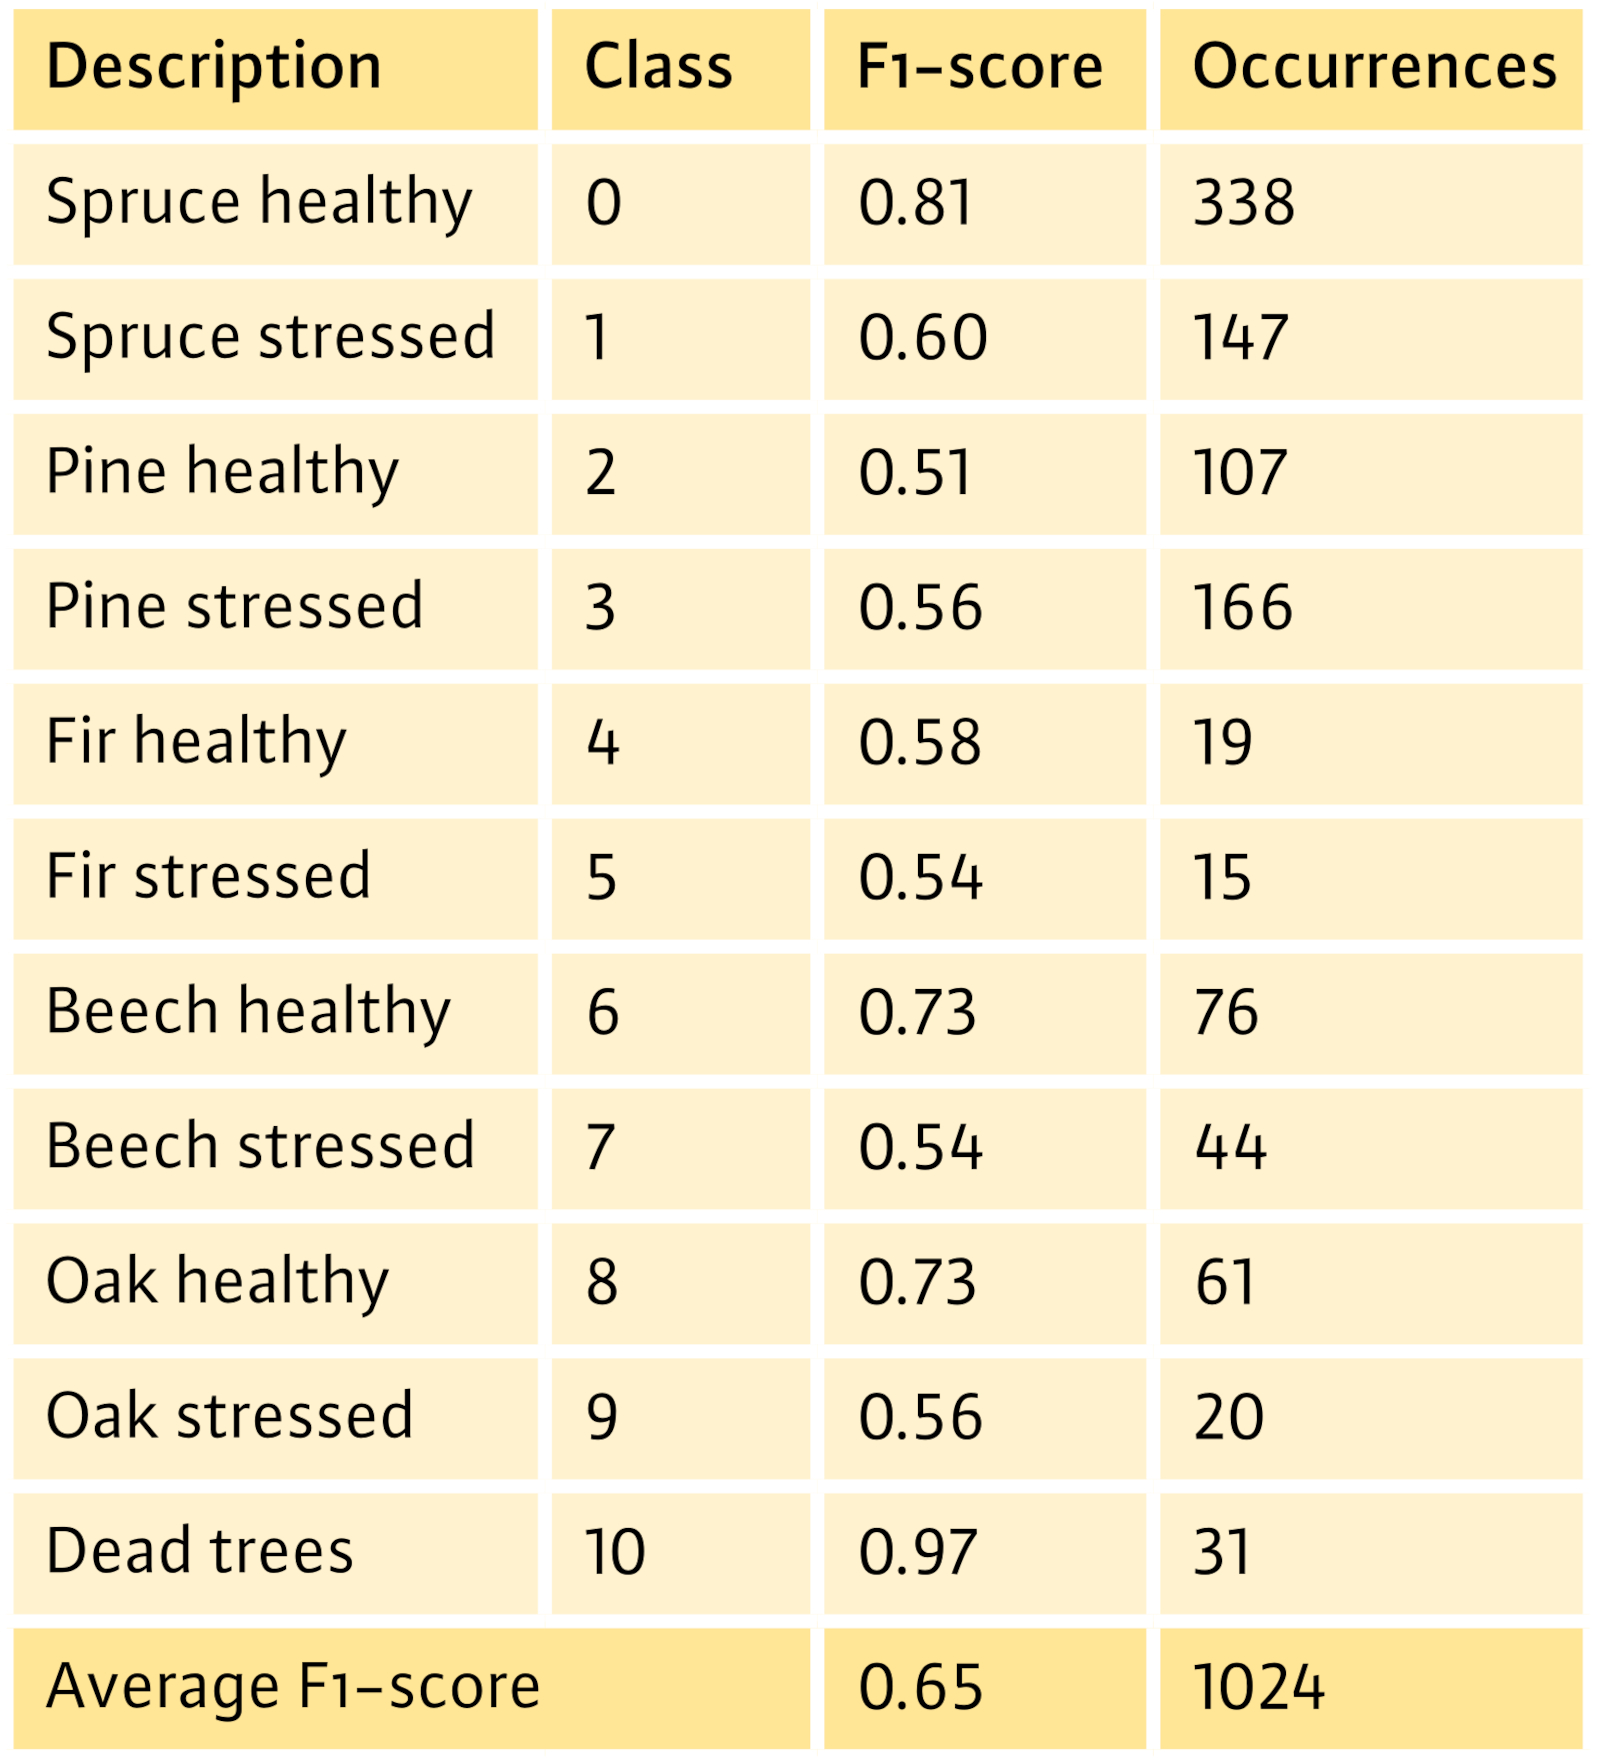
Fig. 5: F1-scores for species-specific crown condition classification. Source: Ecke et al., 2024
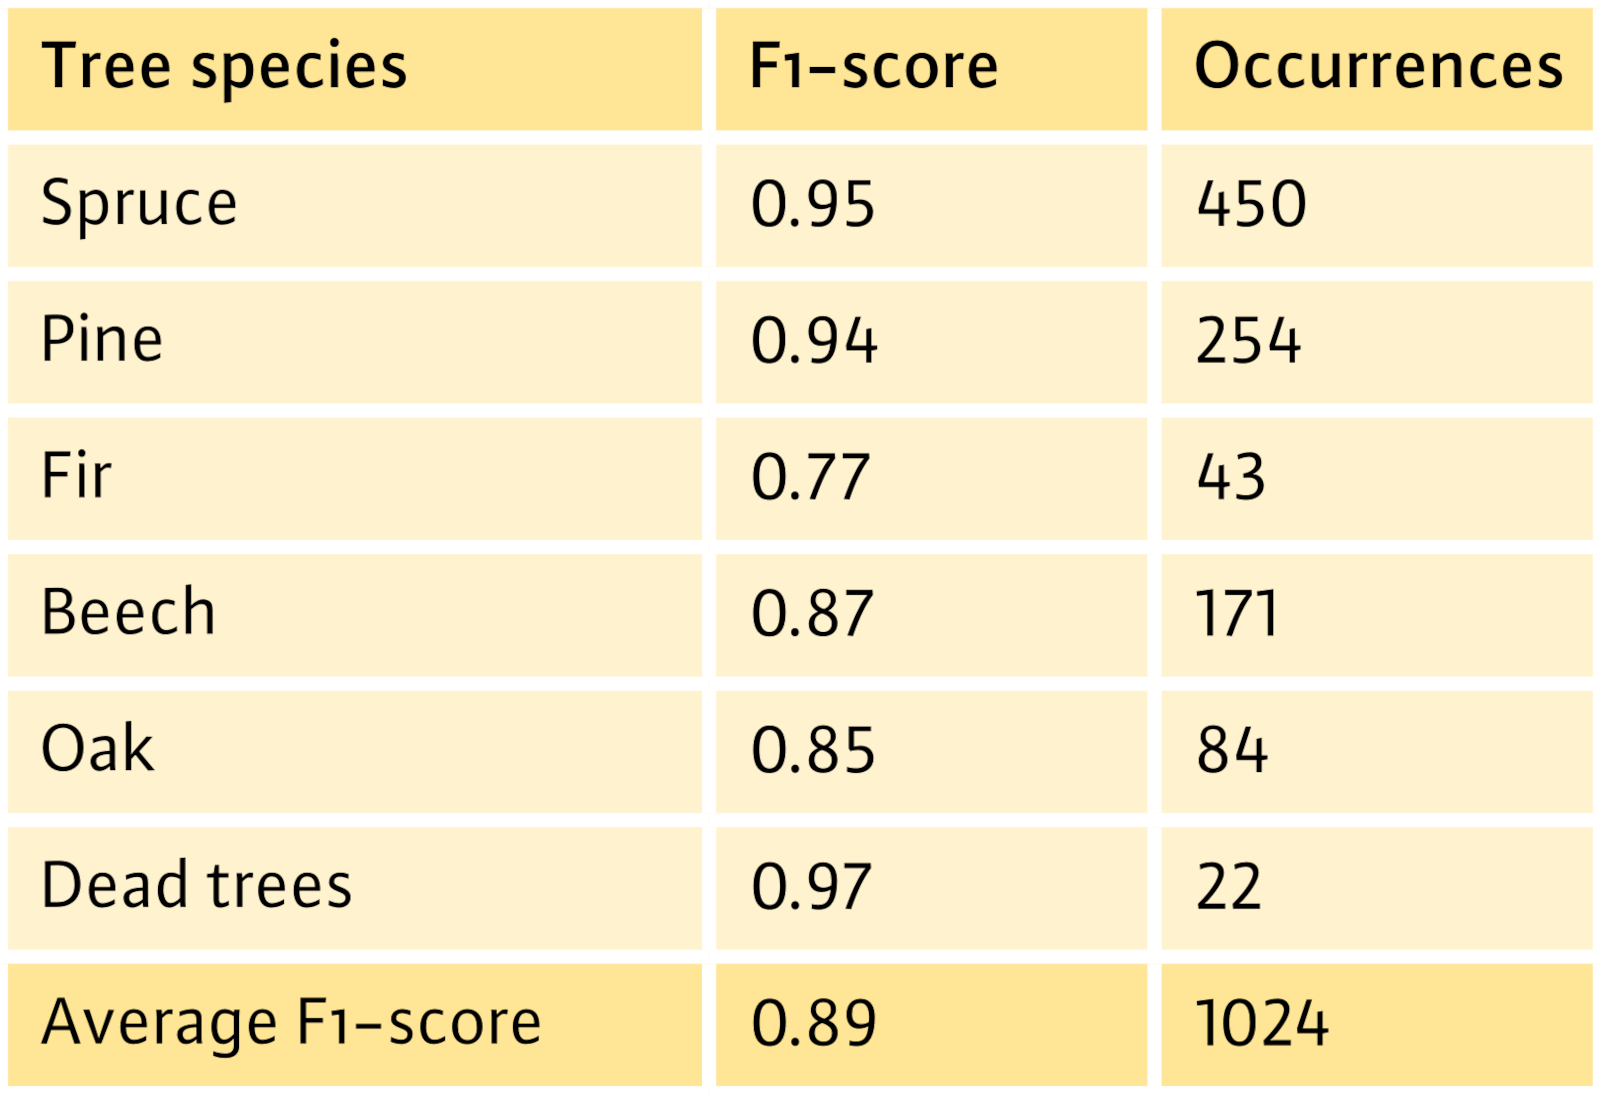
Fig. 6: F1-scores for tree species differentiation. Source: Ecke et al., 2024
Further development to maturity for practical application
The aerial survey of the points in the Forest Condition Survey network was continued annually in Bavaria beyond the duration of the project and was extended to almost all points of the FCS network in Bavaria (including the Alpine region). The last aerial survey to date took place in the summer of 2024. In the meantime, a data set is available for Bavaria that can be used for various digitised evaluation approaches to determine the vitality of forest trees - but also to determine forest inventory parameters in a scientific context. The cost of the UAV flights proved to be comparatively low. It has however increased significantly as a result of the withdrawal of the visual flight exemption for authorities in 2022, as more than one take-off and landing per tract has usually been necessary for forest tracts since then. A simplification of the legal regulations for flights with a low “ground risk” over uninhabited forest areas would be expedient.
The LWF plans to continue the aerial surveys of the Bavarian Forest Condition Survey network in order to continue their evaluation of the approach presented here and to develop it to maturity for practical application. The valuable time series data is available for further geo-referenced scientific analyses.
Summary
As part of the WZE-UAV project, an approach was developed to determine the vitality of forest trees from drone data using vegetation indices. The method was applied at individual tree level for the trees in the terrestrial Forest Condition Survey, and the results were compared. It was shown that high-resolution drone data can be used to achieve a very precise, automated classification of tree species (group). When three vitality classes (vital, damaged, dead) were used, very good agreement with the results of the terrestrial forest condition survey was achieved. When the corresponding class boundaries of the terrestrial Forest Condition Survey were applied, the deviations for the classes of damaged trees were large and did not permit exact differentiation. The approach has been used continuously in Bavaria since 2020 and continues to be refined, in particular by expanding the training database.
The “WZE-UAV” project was funded by the Bavarian State Ministry of Food, Agriculture, Forestry and Tourism (StMELF).
