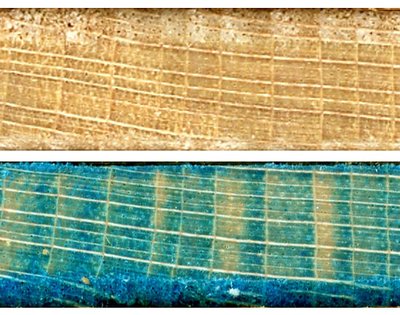
Fig. 1: Sycamore core sample before and after dyeing with astral blue.

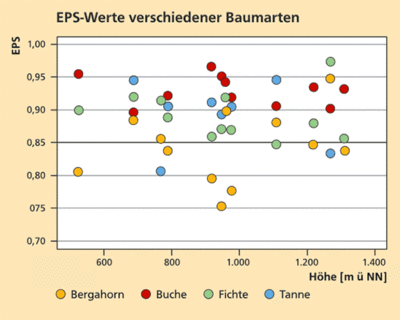
Fig. 2: EPS-value of sycamore (yellow) on the twelve sites in the study in comparison with beech (red), spruce (green) and fir (blue).
On 14 areas, a total of almost 200 sycamore trees in the Northern Limestone Alps in Bavaria and Austria were examined. The study sites were mainly south-facing limestone sites at three different altitudes:
- < 800 m above sea level
- 800-1,000 m above sea level
- > 1,000 m above sea level
The delineation of the annual rings of the light coloured, diffuse-porous sycamore wood are not clearly discernible even under the microscope – a special preparation technique was necessary: The core samples were dyed astra-blue (Basic Blue 140) and sliced with a microtome (see box); some thin sections were also prepared. This allowed the annual rings to be seen clearly (Figure 1).
A microtome is a tool with which extremely thin slices of material can be cut. It is used in microscopy to create samples for later observation under transmitted light or electron radiation.
Nevertheless, it remained extremely difficult to measure the sycamore samples because of the many partially missing or missing annual rings. With many of the trees, continuous annual ring curves could not be synchronised, just certain parts of the curves. For this reason, a smoothed average was taken of all evaluable annual ring curve sections for a site, and all subsequent calculations were carried out on this basis. Many core samples could not be evaluated at all, so there was a different number of cores for each site. Two sites could not be dated at all.
All in all, this indicates that the data quality is considerably worse than the data quality for other tree species. The results can thus only be interpreted as a tendency. The EPS value (Expressed Population Signal, see box) is considerably lower in the case of sycamore than for the other tree species. On approximately half of the sites, the usual threshold value of 0.85 for an adequate statistical quality of the data is not reached (Figure 2).
The Expressed Population Signal (EPS) is a quality criterion for the establishment of the chronology of annual ring curves. It tells us how well a hypothetically perfect chronology (EPS=1) is represented.
Reaction to dry years
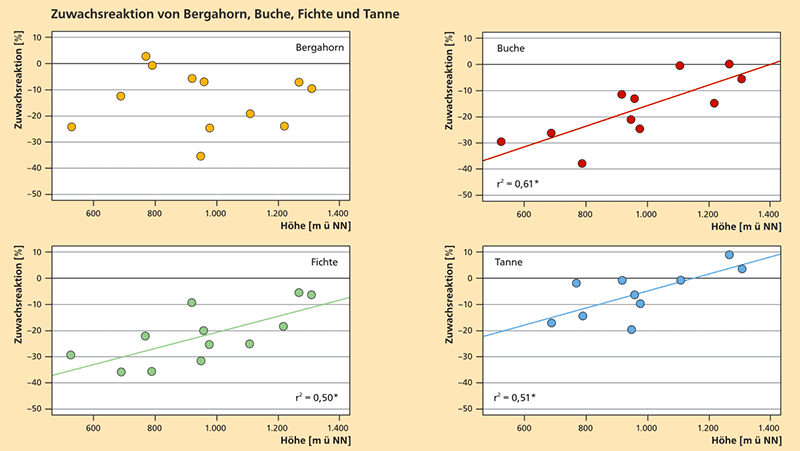
With the percentage change of the radial growth of sycamore, beech, spruce and fir in the dry years 1947, 1992 and 2003 (in comparison with the five previous years in each case), considerable differences between the tree species can be discerned depending on the elevation (Figure 3). With spruce, beech and fir, there is a significant correlation between the fall in growth and elevation.
- Spruce: The fall in growth is greatest at lower elevations and declines with increasing elevation.
- Beech: shows a similar tendency to spruce, with slightly lesser declines in growth.
- Fir: The decline in growth is only slight; at higher elevations, the growth increases in the dry years.
With the sycamore, no correlation between elevation and growth reaction can be detected. The values for individual sites are very scattered (also due to the poor quality of the data). The average decline in growth for all sites is slight and can quickly be made up again in subsequent years. Altogether the sycamore thus seems to react only slightly to dry years, and in lower areas in particular, it is less vulnerable than the spruce or beech.
Long-term relationship between climate and growth
The correlation coefficient (Figure 4) shows the relationship between temperatures in the vegetation period and annual ring width. The spruce responds to high temperatures in the lower areas with a decline in growth. As higher temperatures lead to higher water consumption and are often coupled with lower precipitation levels, this is presumably the consequence of a lower availability of water. In contrast to this, the correlation coefficient for sycamore is positive even in lower areas. The sycamore responds to increased temperatures with an increase in growth. The lower availability of water associated with the increased temperatures does not have a negative effect on the sycamore.
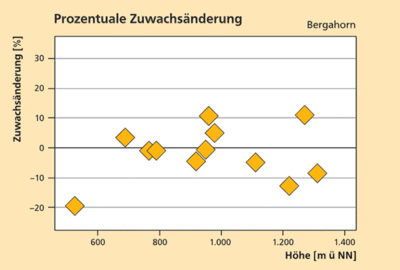
The rise in temperature of approx. 1° C since 1990 in the vegetation period is not however reflected in the annual ring widths in sycamore. In comparison with the reference period 1941-1970, no specific trend in growth change is to be detected (Figure 5). The duration and strength of the rise in temperature up to now have presumably not been considerable enough, or the growth of the sycamore is dominated on the studied sites by other factors (e.g. availability of nutrients).
Summary
On the sites in the study, the sycamore reacts only slightly to the dry years. In the long-term, higher temperatures in the vegetation period tend to have a positive effect on the growth of the sycamore. The rise in temperature since 1990 has not to date had any significant effects on the growth behaviour of the sycamore, indicating that the tree has been able to adapt well to climate change as it has occurred up to now.
Altogether the study confirms the assessment that the sycamore is a relatively drought-resistant tree species. With regard to the climate stability of mixed mountain forests, a greater role for the sycamore in natural regeneration is something that should be viewed positively.


