

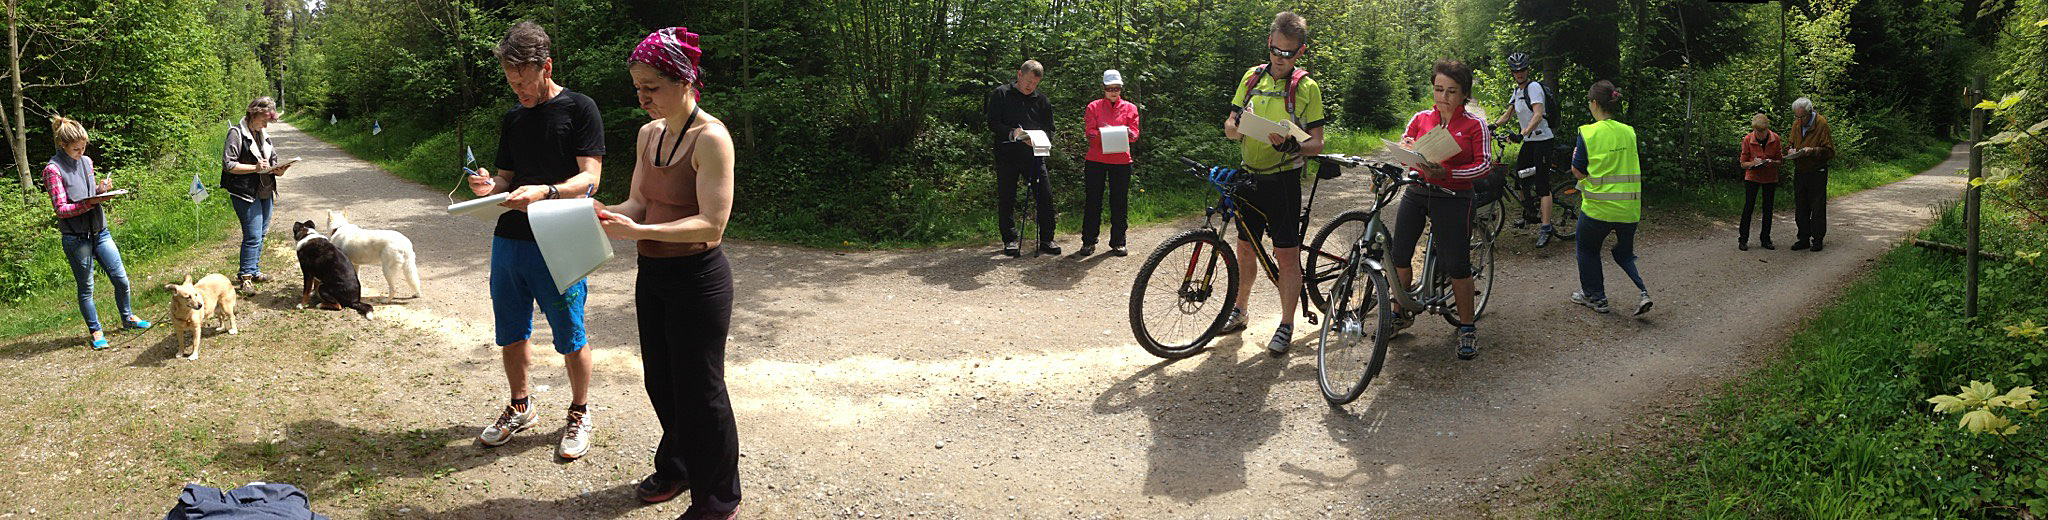


Fig. 1. Data on forest visits can help us to manage visitor flows in such a way that any adverse effects are kept to a minimum. Photo: Barbara Allgaier Leuch (WSL)
Swiss forests are being used more intensively than ever before – and yet data on the number of visitors and when and where they visit is rarely recorded systematically and usually only in small, localised areas. A WSL project has examined the current state of available monitoring methods and datasets for Switzerland and tested a modelling approach. Its conclusion: the foundations are there, but there is still no nationwide, standardised system for monitoring forest visits.
Why count visitors to the forest?
The Swiss forest serves simultaneously as a protected area, a production area, and a recreational space. In an increasingly urbanised society, the forest’s role as a recreational space is gaining in importance, although this also leads to conflicts with its other functions. Such conflicts should be kept to a minimum in order to keep the pressure on the forest as low as possible.

Fig. 2. People are particularly drawn to the forest in fine weather. Models allow us to map out the finer details of these relationships and make predictions. Photo: Adobe Stock
This requires answers to specific questions: When do people spend time in the forest, how many of them are there, and where in the forest do they go? What do people do in the forest, and how long do they stay there? With the answers to these questions, it is possible to assess the impact and, where necessary, take appropriate measures, such as erecting information boards or expanding infrastructure. Integrated, long-term monitoring systems help us to collect data on forest visitors and play a key role in improving management decisions.
Data collection: a challenging task
No single monitoring method provides a complete picture of visits to the forest. Data is often difficult to collect and incomplete. Nevertheless, it can provide an initial picture of the situation in the forest, and the data is particularly valuable when the different sources are combined. It can also serve as a basis for models that can predict visitor numbers depending on various factors, such as the weather or the day of the week. However, whether such models are accurate in their predictions depends heavily on the data on which they are based.
Obtaining reliable data on visitor numbers in the forest is no easy task. There is a lack of standardised measurement methods in Switzerland, and all the methods used have their limitations, as the examples of three different measurement methods show.
Traditional visitor counts
Automated or manual counts of forest visitors are classic measurement methods. However, they are not as straightforward to carry out as they might appear. The problem begins with the fact that Swiss forests do not usually have a central entrance. It is hardly practicable to cover all access points to a forest for the purposes of a visitor count. Counts carried out by people are also labour-intensive and often expensive, and therefore cannot be carried out over long periods of time. They can however be combined with surveys, as done for example in the WaMos meets LFI (WML) project. Combined counts and surveys can provide information not only on how many people are in the forest, but also on who is visiting the forest and for what purpose. Automated measurement methods such as camera traps or pressure mats are less labour-intensive, but can only detect that a measurement point has been passed. They cannot provide any information on visitor behaviour in the forest or about the visitors themselves.
Fitness tracking apps such as Strava
With tracking apps such as Strava, sports enthusiasts can record activities such as jogging or cycling with precise map locations and make this data freely available. This data provides information on how many people have engaged in which activities and where in the forest. The data does however have one major limitation: a visit to the forest only appears in the dataset if the person records it on Strava. Strava users are mostly sporty and tech-savvy – which does not apply to all forest visitors. While the Strava data may provide useful insights into the forest visits of individual people, it is not representative of all forest visitors.
Mobile data
Another way of collecting data is to analyse mobile device data. Swisscom, for example, sells data derived from mobile device connections to mobile network masts. This data shows the people density on geographic “tiles” measuring 100 m x 100 m. Such data can be used as a representative sample and allows mobility to be observed over long periods of time. It can also be used to show the number of forest visitors on a heatmap (fig. 3).
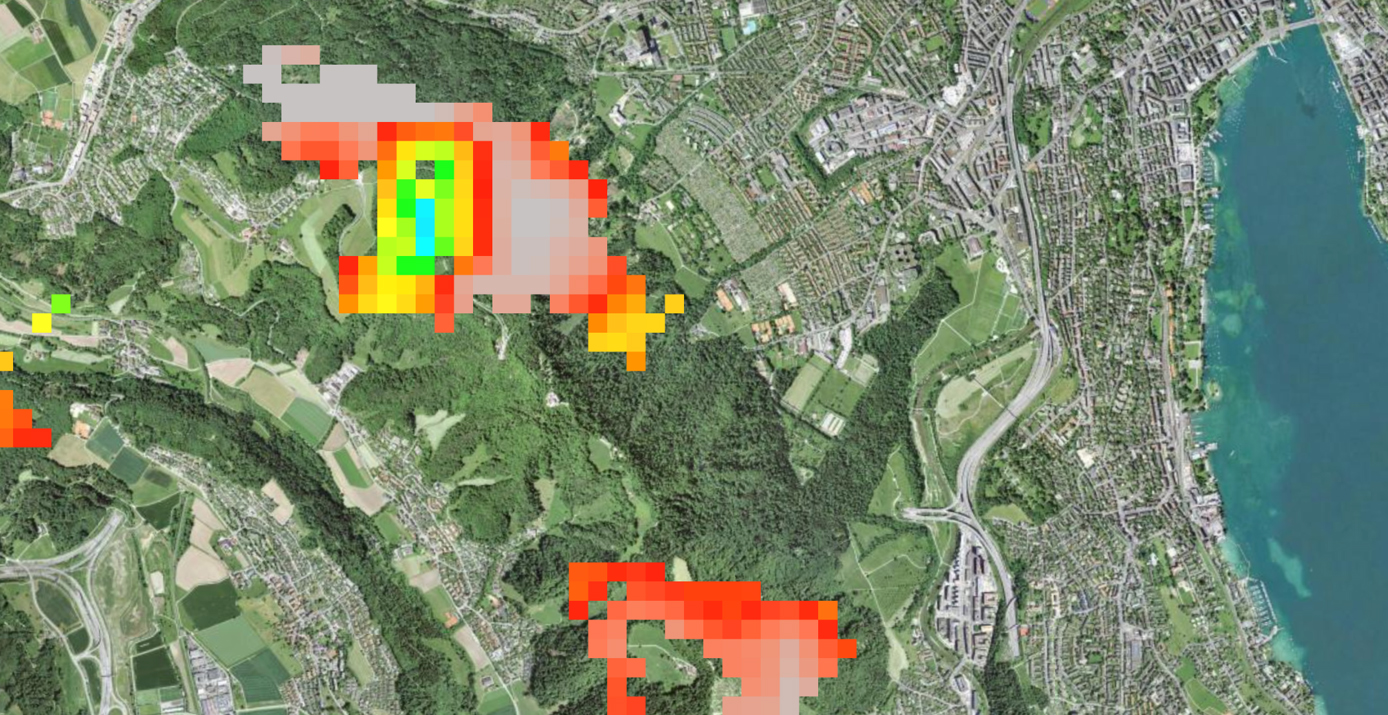
Fig. 3. Heatmaps use mobile device data to show visitor frequency in forest areas, using the Uetliberg mountain as an example. Source: Medici et al. (2026)
A heatmap provides a graphical representation of how high the density of people is in a given area. However, here too, the figures do not necessarily reflect the actual number of visitors. For data protection reasons, Swisscom only publishes mobile device data if there are more than 20 people on a particular geographical tile. This measurement method is therefore not suitable for areas with low visitor numbers. Furthermore, Swisscom is unable to determine the purpose for which a person is in a particular area. Consequently, people passing through a patch of woodland on the road or in a train, or who live right next to it, are shown on the heatmap in exactly the same way as people who are out for a walk there. For this reason, the tiles around settled areas and transport routes must be blanked out.
Reliable findings thanks to the combination of different data
Each of these methods provides images which, while still blurred, nevertheless allow us to discern outlines. The data can provide insights into the number of visits to the forest, and in some cases even pinpoint their exact location and time. When you combine different types of data – such as visitor records, surveys, Strava and Swisscom mobile data – trends can become clearer, particularly when they are evident across several datasets.
Modelling rather than just measuring
Models combine different datasets and reveal how factors such as the weather, the day of the week and population density interact. Statistical calculations make it possible to run through various scenarios and to develop reliable predictions.
Ideally, a model extracts maximum value from the data by highlighting correlations and enabling predictions. It therefore allows conclusions to be drawn that would not be apparent from the raw data alone.
Which method is used where?
In principle, any method for recording forest visits can be used at any level. The boundaries between the relevant areas of application are fluid, and the data collected and models at one level can be fed back into the other levels. Nevertheless, there are certain trends indicating which approach is most suitable where.
Forest district level: At the forest district level, traditional counting methods such as counting devices – supplemented where appropriate with targeted surveys and observations – are particularly useful. Mobile data is also affordable at this level. Furthermore, models can assist with planning.
Regional level: At regional level, it makes most sense to combine survey data, count data and mobile data from the forest district level, although regional surveys and models may also be used.
National level: At national level, surveys, syntheses of local and regional surveys and data, and above all models are helpful. Here, too, the combination of count data with other data yields the most reliable results and provides the basis for models.
Three principles for any monitoring programme
- First define the requirements: Is it about managing visitor flows, protecting nature, planning infrastructure, or monitoring trends?
- No single tool can solve the problem – methods should be combined to obtain a representative picture.
- When dealing with digital data, check for any bias and check data protection requirements before drawing conclusions.
The bottom line
Direct measurements – i.e. counts and surveys – and models are not exchangeable, but two parts of the same toolkit: the former provide the empirical basis, while the latter extend this both spatially and temporally. It is clear where the greatest potential for development lies – in longer data series, better integration of existing sources, and the combination of traditional methods with modern mobility data. The foundations of a sustainable forest visitor monitoring system in Switzerland are already in place.
Translation: Tessa Feller
Original scientific publication
Medici M., Hegetschweiler T., Hunziker M. (2026) Ermittlung und Modellierung von Erholungs- und Freizeitbesuchen im Schweizer Wald. WSL Ber. 195: 57 S. doi.org/10.55419/wsl:43161